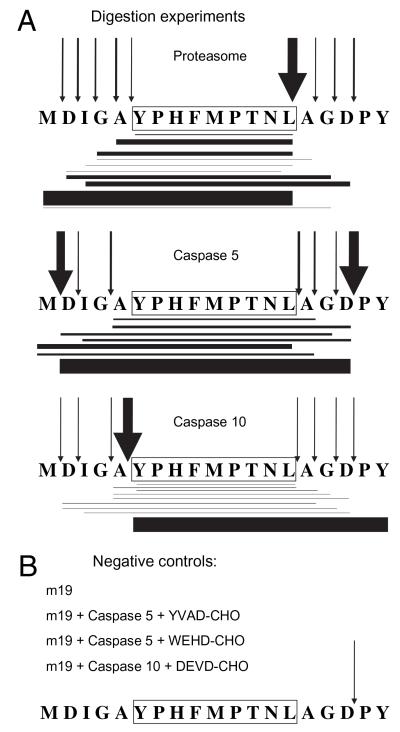
FIGURE 4. Digestion pattern of m19 synthetic peptide with purified proteasomes or different caspases analyzed by MS.
The m19 synthetic peptide was digested with the indicated purified proteases (A) or negative controls (B) and analyzed by MS/MS. The sequence of the CMV epitope is boxed. Horizontal lines show peptide products identified by MS/MS analysis. Line thickness indicates approximate amount detected. The arrows indicate cleavages. Their thickness indicates frequency of each cleavage, deduced from the approximate amounts of identified peptide products. Amounts are depicted relative to the most abundant product within each digestion.

