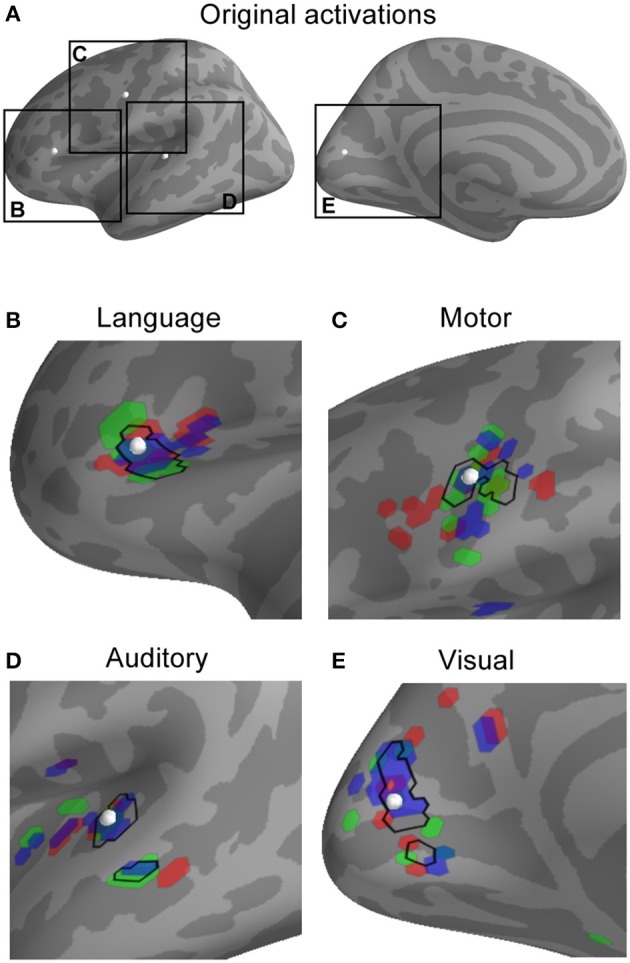
Figure 1.

Observed activity patterns resulting from simulated activation in representative locations in language, motor, auditory, and visual areas. The location of each simulated active dipole is shown (white spheres in A) as well as individual activation patterns (B–E). For each location, the source activation was projected into the MEG sensor space (as potentially observable data) and then the minimum-norm inverse solution with spherical morphing was used to map the activity to a common brain. In the plot for each region (language, motor, auditory, visual), the top 25 most active points for three different sample subjects are shown in red, green, and blue, alongside the top 25 most active points for the average across all subjects (black outline). Note that the point-spread functions—indicated by activity that has moved or even jumped sulci or gyri away from the location of underlying true activity—differ between subjects, and that the average across subjects is converging toward the point of original activation.
