Figure 4.
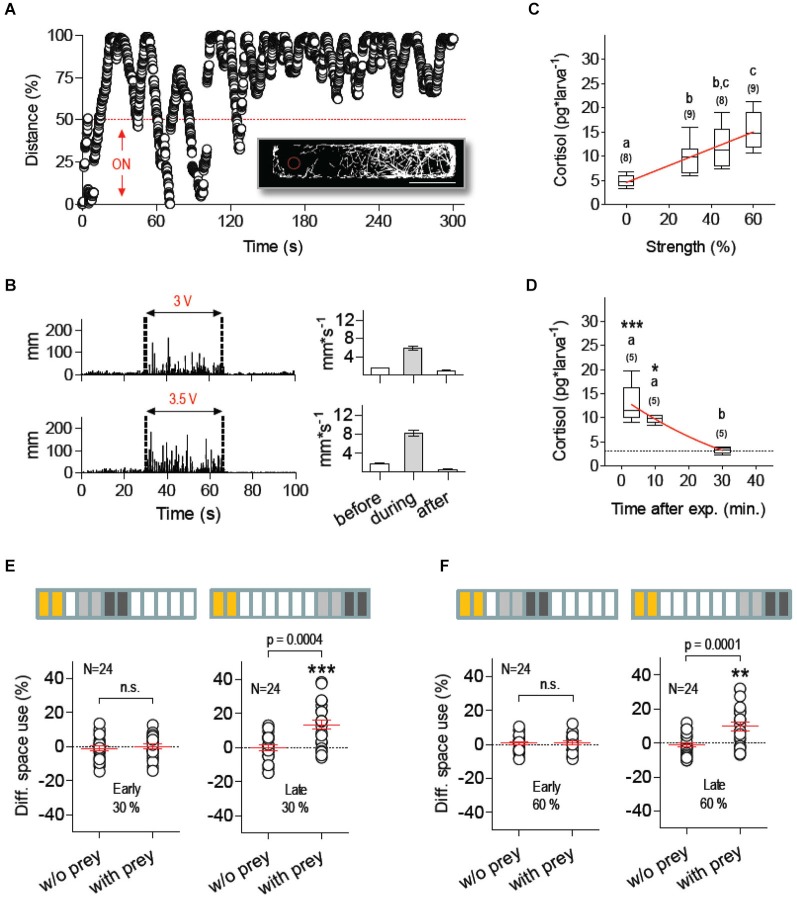
Mechanosensory stress suppresses feeding. (A) Distance (in % relative to maximum) every 40 ms between a single larva swimming in darkness at 28°C (±0.1°C) and the submerged tip of a silica capillary tube fixed to a computer-controled piezo bender actuator. The capillary’s tip (stimulus source) moves laterally upon voltage applied to the actuator, thereby causing fast hydrodynamic flows. The bender’s LDs (of known frequency and duration) can be triggered at any given time or only when the larva swims within pre-defined areas of the swimming chamber, such as the half of the chamber containing the stimulus source (ON, bottom). Larvae respond to the stimulus by increasing the distance to the source. Insert: x-y coordinates from an exemplary 300 s track illustrating how a single larva avoids the area surrounding the source (red dashed circle, scale bar, 10 mm). (B) Left: distance swam by representative larvae before, during (between dashed lines) and after stimulation of increasing stimulus strength (delivered at 1 Hz), as determined by the voltage applied to the bender (Vact), either 3 (top) or 3.5 V (bottom); right: average distance swam before, during and after stimulation. (C) Whole-body cortisol measured 10 min after stimulation as a function of stimulus strength (in % relative to maximum Vact); linear regression (p < 0.0001) designated by red line. (D) Cortisol level as a function of time after stimulation (stimulus strength: 60%). Asterisks designate statistical differences as compared to basal levels (*p < 0.05, ***p < 0.001). Non-linear regression (R-square = 0.77) designated by red line (C,D: different letters designate statistical differences determined by one-way ANOVAs followed by post-hoc comparisons; sample size in parentheses). (E,F) DSU in larvae pre-exposed to mechanosensory stress using stimulus strength levels of 30% (E) and 60% (F), defined as in (C) (asterisks designate results from one-sample t-tests against 0, **p < 0.01, ***p < 0.001). Top bars: each rectangle represents a 5 min time period; from left: mechanosensory stimulation (yellow), first 10 min period without prey (light gray), second 10 min period with prey (dark gray). Shown are DSU values measured either 5–25 min (left, early) or 30–50 min (right, late) after mechanosensory stimulation.

