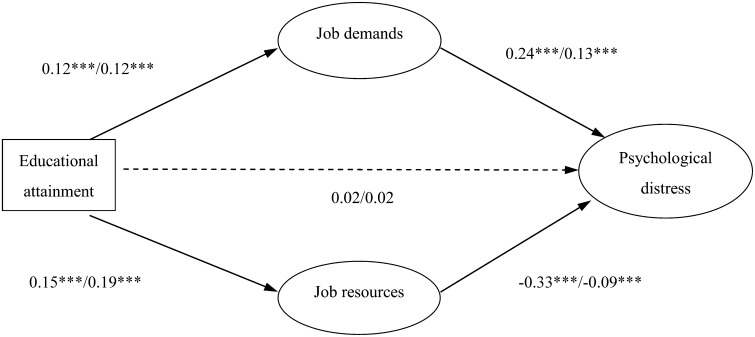
Fig. 1.
Standardized solution (maximum likelihood estimates) of the hypothesized model.
Standardized coefficients for Study 1 (J-HOPE) and Study 2 are displayed before and after slash, respectively. Dotted line represents nonsignificant path (p>0.05). Observational variables and error terms were omitted for clarity. *** p<0.001.

