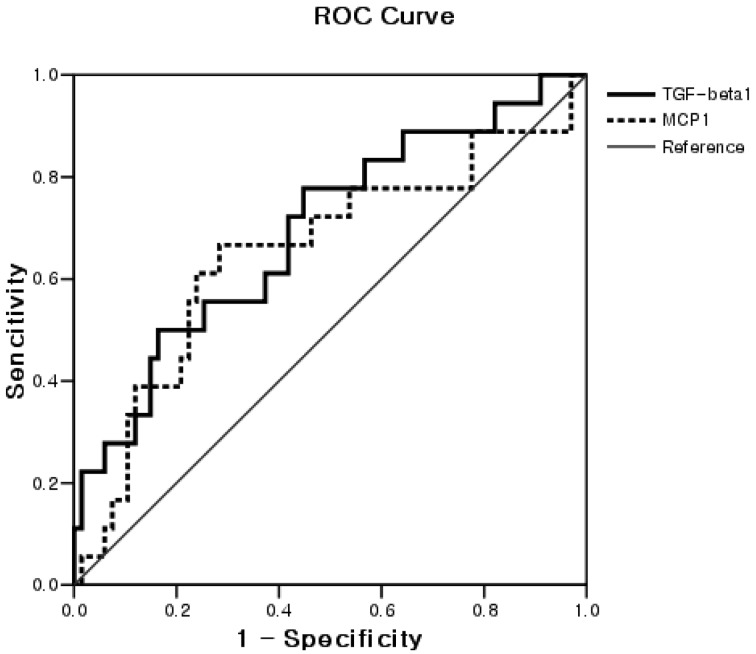
Fig. 1.
ROC curve for TGF-β1 and MCP-1 according to progression of CWP (n=85). The areas under the ROC curve for TGF-β1 and MCP-1 were 0.69 (95% CI, 0.55–0.84, p=0.012) and 0.65 (95% CI, 0.50–0.81, p=0.048), respectively. The optimal cutoff values of TGFβ1 and MCP1 for the progression of pneumoconiosis were 79.2 ng/ml (sensitivity and specificity of 61.1% and 61.2%) and 34.3 pg/ml (sensitivity and specificity of 66.7% and 67.2%), respectively.

