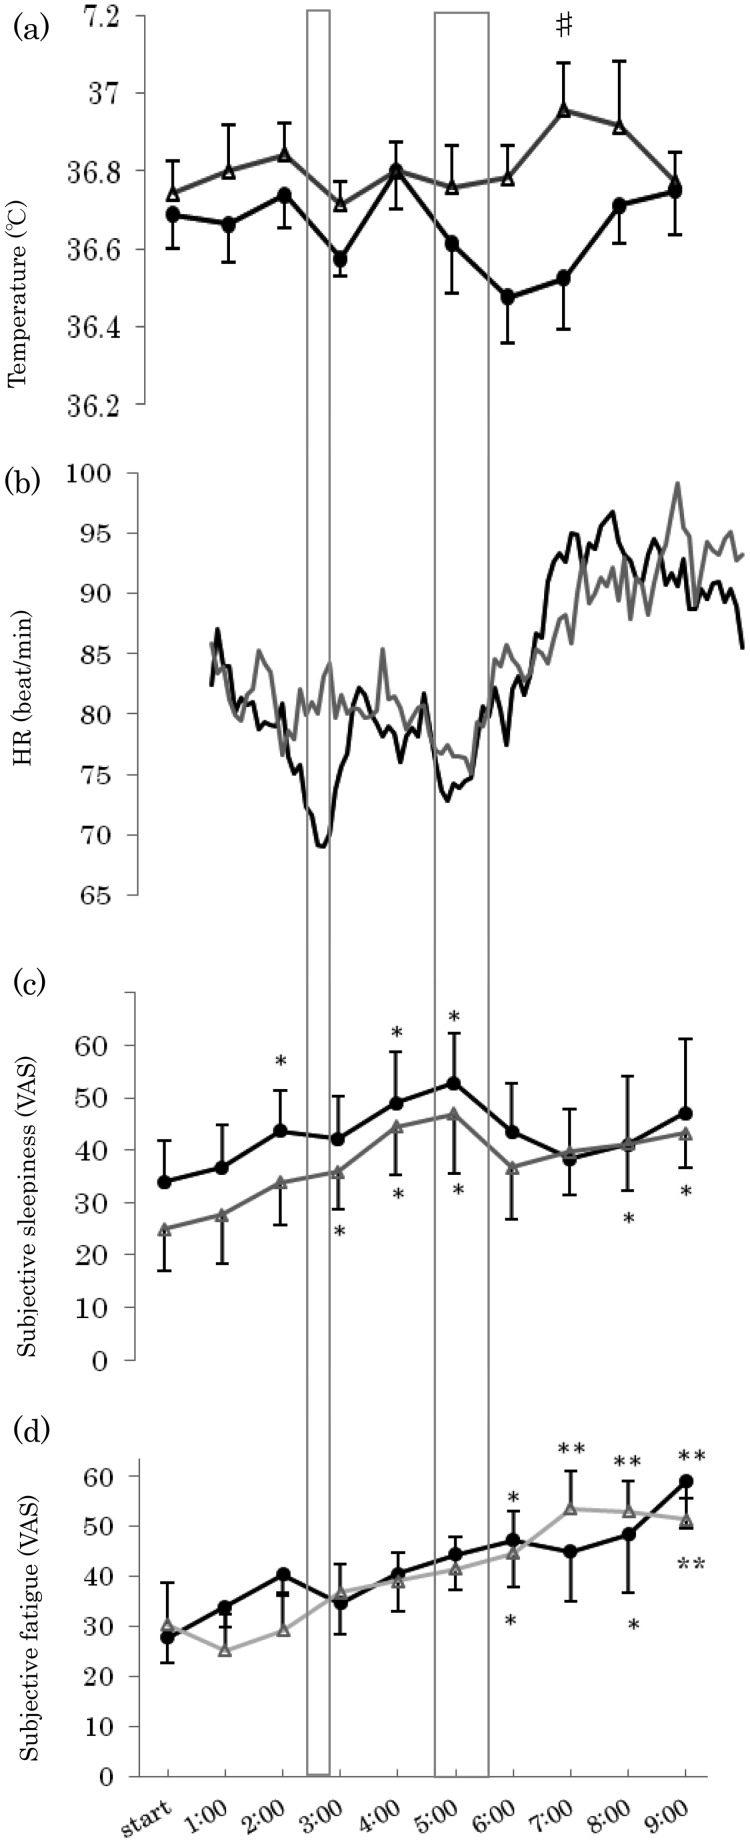
Fig. 1.
Mean ± SE hourly values for (a) Changes in temperature, (b) Changes in heart rate, (c) Subjective sleepiness, and (d) Subjective fatigue. (·), Nap condition; (△), No-nap condition. Significance was plotted compared with baseline values for nap and no-nap in all 4 graphs. (**: p<0.01;*: p<0.05). Significance was plotted compared with the No-nap condition in all graphs. (#: p<0.05). The Nap condition was between 2:30 and 3:00 (first nap), and between 4:30 and 5:45 (second nap).

