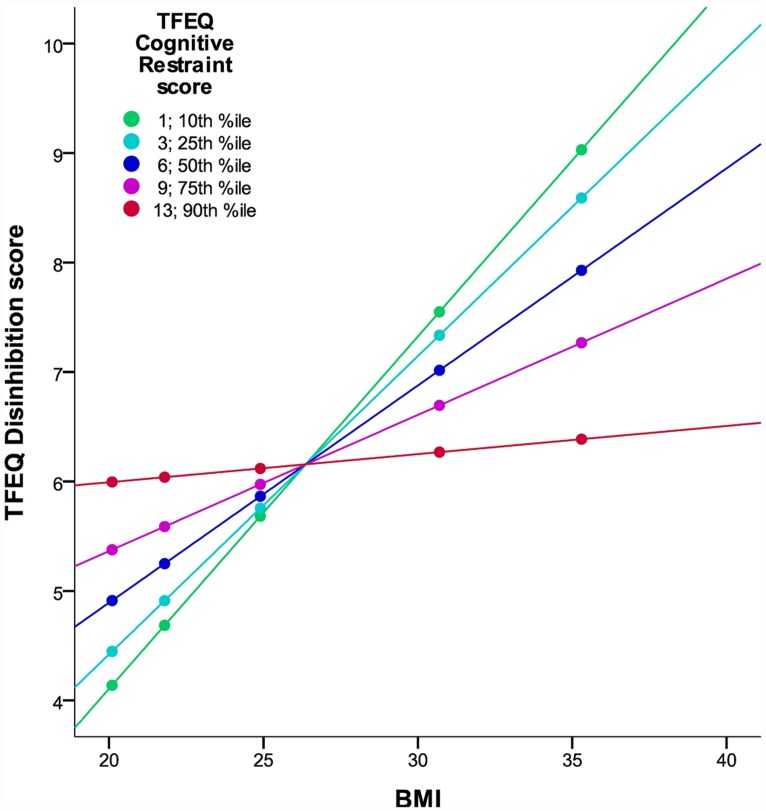
FIGURE 1.
Interaction of DIS and CR on BMI in the TFEQ-only cohort (n= 326). The figure illustrates the linear relationship between BMI and DIS moderated by the level of CR with age and gender as covariates. Partial correlation of BMI*CR is -0.203 (p < 0.0005; adjusted R2 change of 0.163 through BMI, CR, and BMI*CR). Dots indicate 10th, 25th, 50th, 75th, and 90th percentiles of BMI (20.1, 21.8, 24.9, 30.7, and 35.3 kg/m2). Colors indicate 10th, 25th, 50th, 75th, and 90th percentiles of CR (1, 3, 6, 9, 13). CR, cognitive restraint score; DIS, disinhibition score; TFEQ, Three-Factor Eating Questionnaire.

