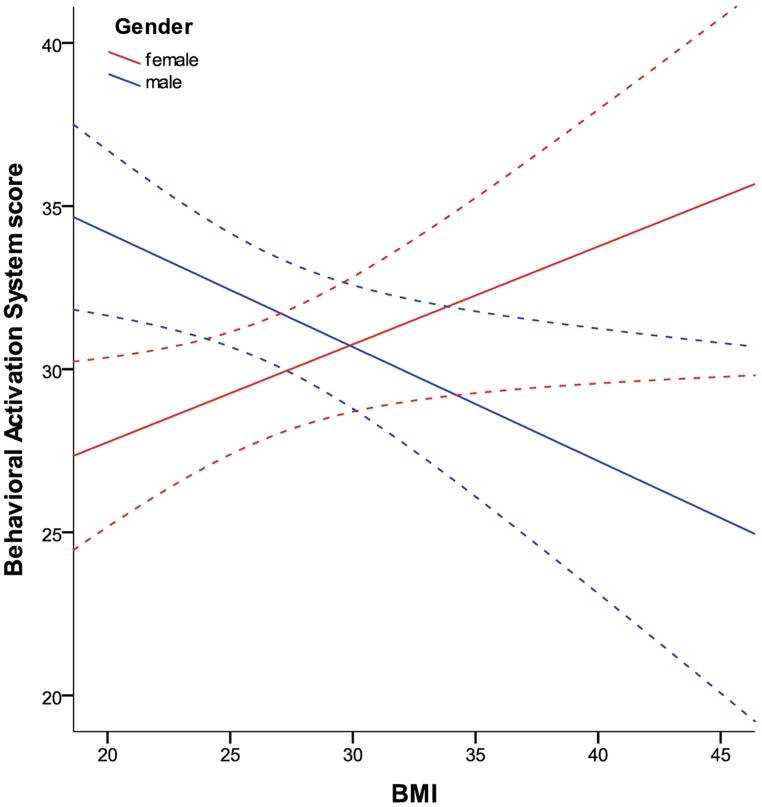
FIGURE 3.
Relationship between BMI and BAS in women and men in the TFEQ-plus cohort (n= 192). As the relationship of BAS and BMI is moderated by gender, it is shown separately. Partial correlation of BMI*gender is -0.255 (p< 0.0005, age as covariate). Partial correlation of BMI (age as covariate) with BAS is 0.214 in women (n= 82) and -0.295 in men (n= 110). Dashed lines indicate confidence interval of 95% for the fit lines. BAS, Behavioral Activation System total score.

