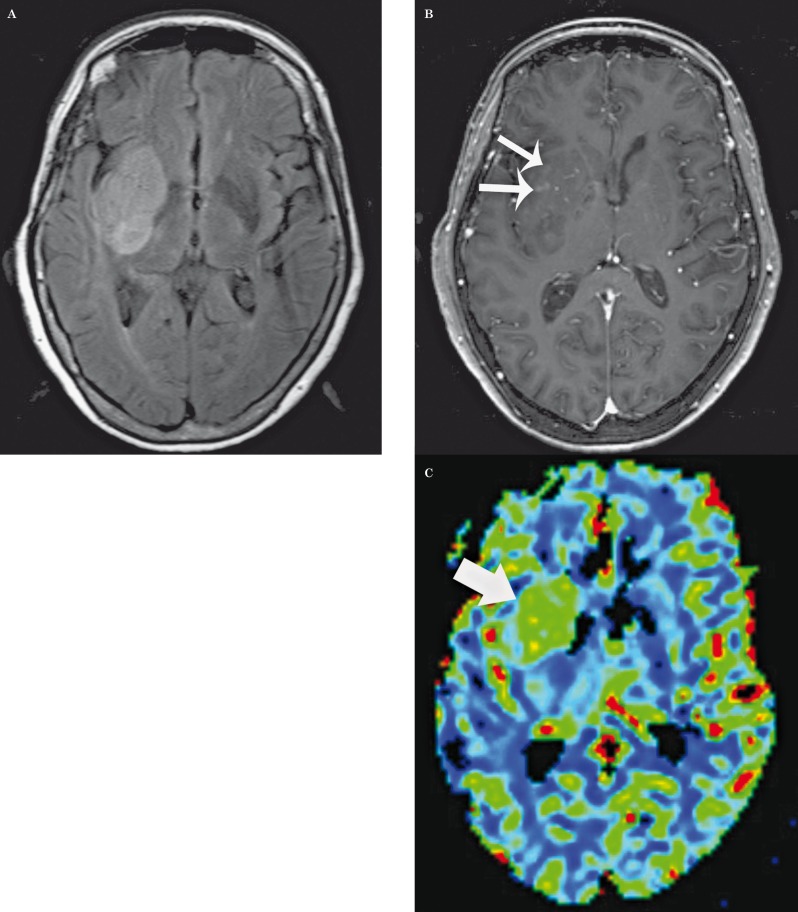
Figure 2.
Glioblastoma multiforme: axial FLAIR (A), post-contrast T1-weighted (B) images, and corresponding relative CBV map (C) demonstrate a relatively homogenous and well-defined right basal ganglia mass with only a few ill-defined foci of enhancement (small arrows), but with increased CBV (large arrow). There was progression of disease within 90 days.

