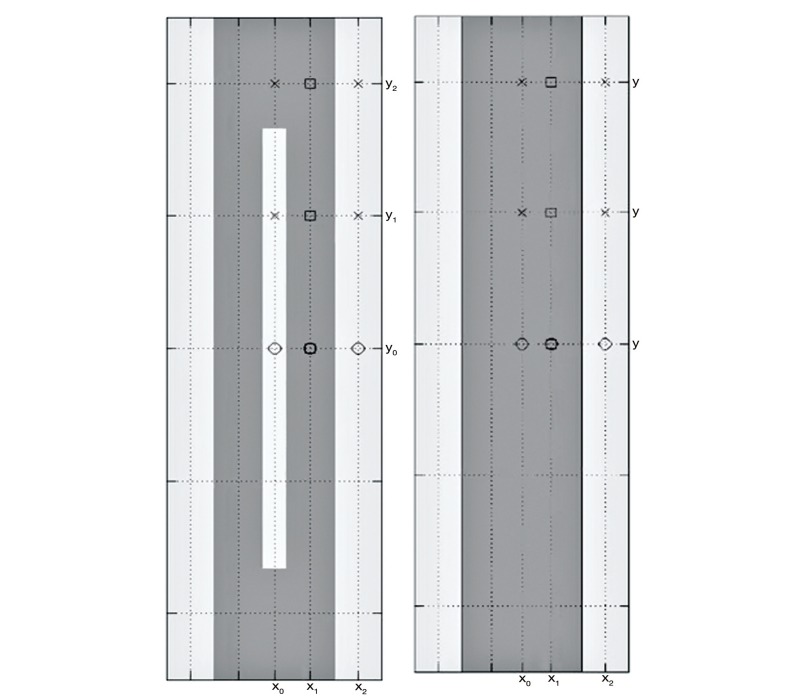
Figure 1.
Graphic representation of the two models used in the study. The model with the solid cord (right) illustrates the simulated fluid space surrounding the cord in light gray and the simulated spinal cord in darker gray. The model on the left illustrates a central spinal canal in the cord in light gray. The canal has a width of 0.2 cm and extends to within a centimeter of each end of the model.

