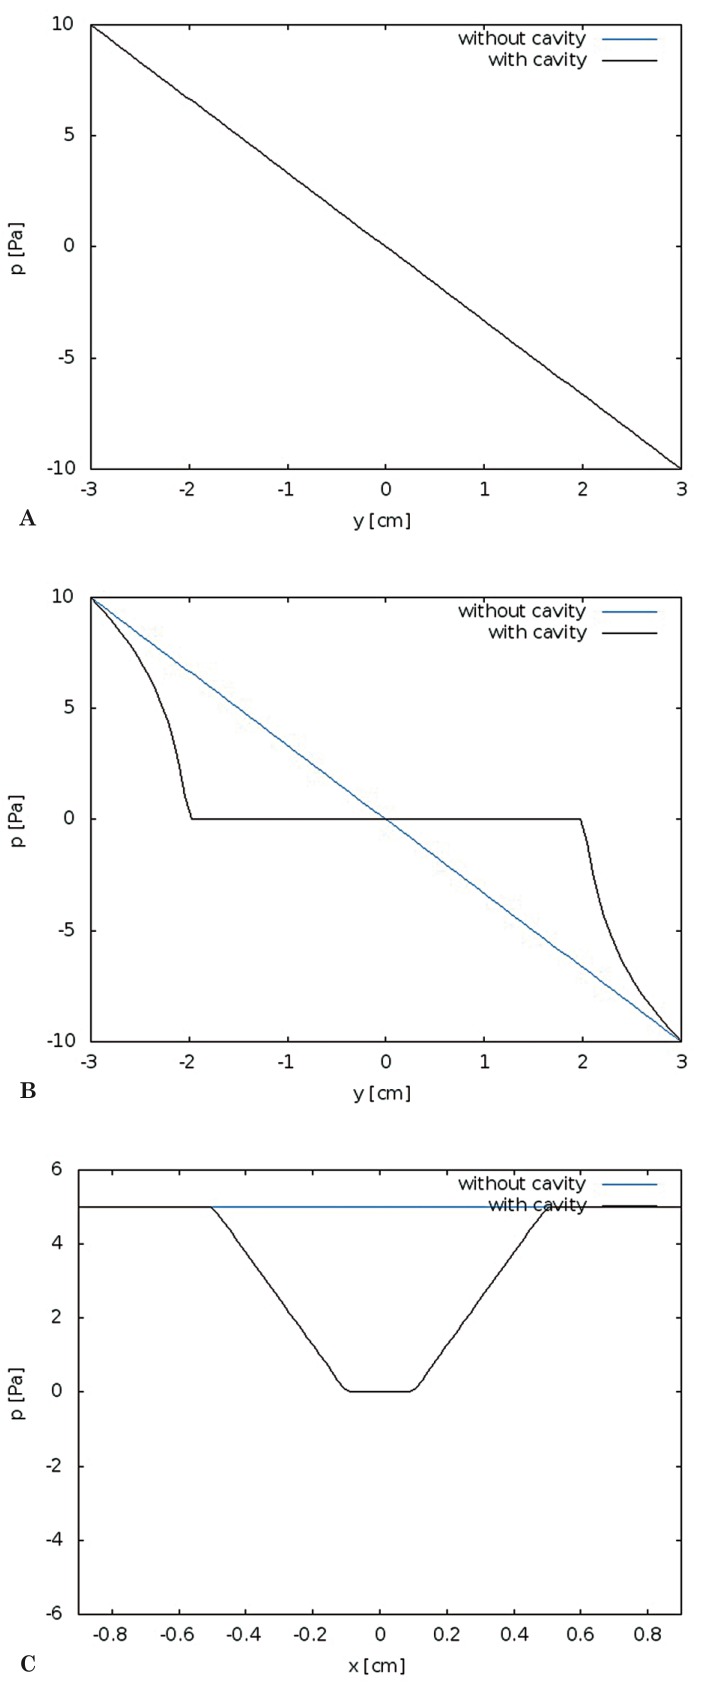
Figure 4.
Pressure gradients plotted for the two models at t = 0.5. Pressures plotted longitudinally (A) for the fluid space external to the cord at t = 0.5 show pressure decreasing linearly in both models. Pressures plotted along the midline of the models (B) show a non-linear decrease in pressure in model 2. Where the central canal is present, pressures do not change with distance along the model and at either end of the central canal pressures change more rapidly than in model 1. Pressures plotted transversely across the models (C) show a constant pressure in model 1 and a pressure gradient varying with distance from the central canal in model 2.

