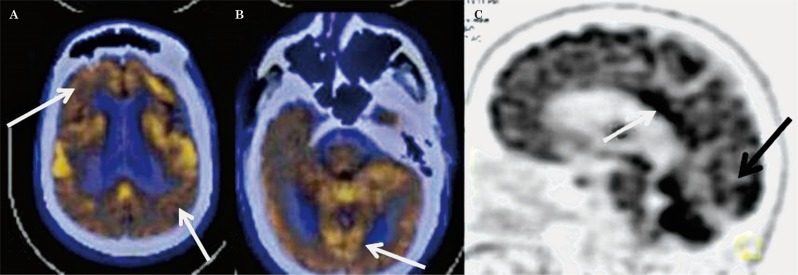
Figure 3.
Transaxial fused FDG-PET/CT images in a case of DLBD showing hypometabolism in both frontal and parietal cortices (A) and also in the visual cortices (B, arrow). C) Lateral maximum intensity projection image showing hypometabolism in the visual cortices with preserved metabolism in the posterior cingulate (arrow).

