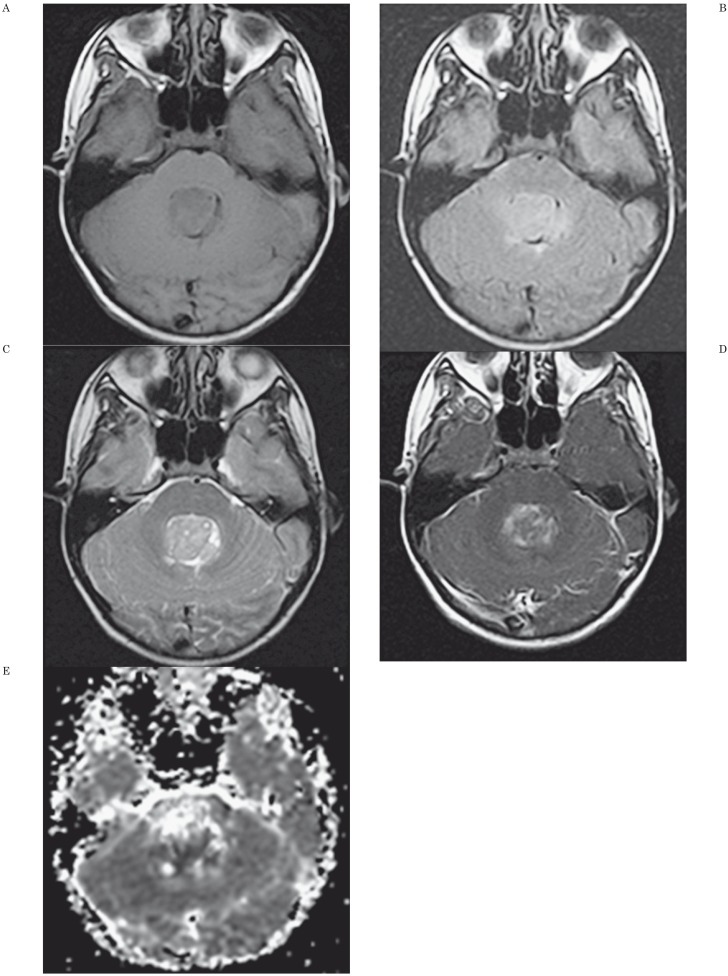
Figure 1.
MR Findings and ADC map in a 12-year-old girl with a medulloblastoma. A) Axial unenhanced T1-weighted image shows mass lesion in fourth ventricle. B) Axial fluid-attenuated (FLAIR) image shows a mildly hyperintense lesion compared to adjacent brain. C) Axial T2-weighted image shows the mass is inhomogeneous and hyperintense to adjacent brain. D) Axial contrast-enhanced T1-weighted axial image shows inhomogeneous contrast enhancement of the tumor. E) Axial apparent diffusion coefficient map shows the central portion of the tumor has low signal intensity. ADCmin was 0.531 × 10⁻³ mm2/s and nADC value was 0.733. The threshold values used in our study (ADCmin of 0.66 × 10⁻³ mm2/s and nADC of 0.905 for distinguishing medulloblastoma from astrocytoma, ependymoma, and other tumors) allowed discrimination of this medulloblastoma from other tumors.

