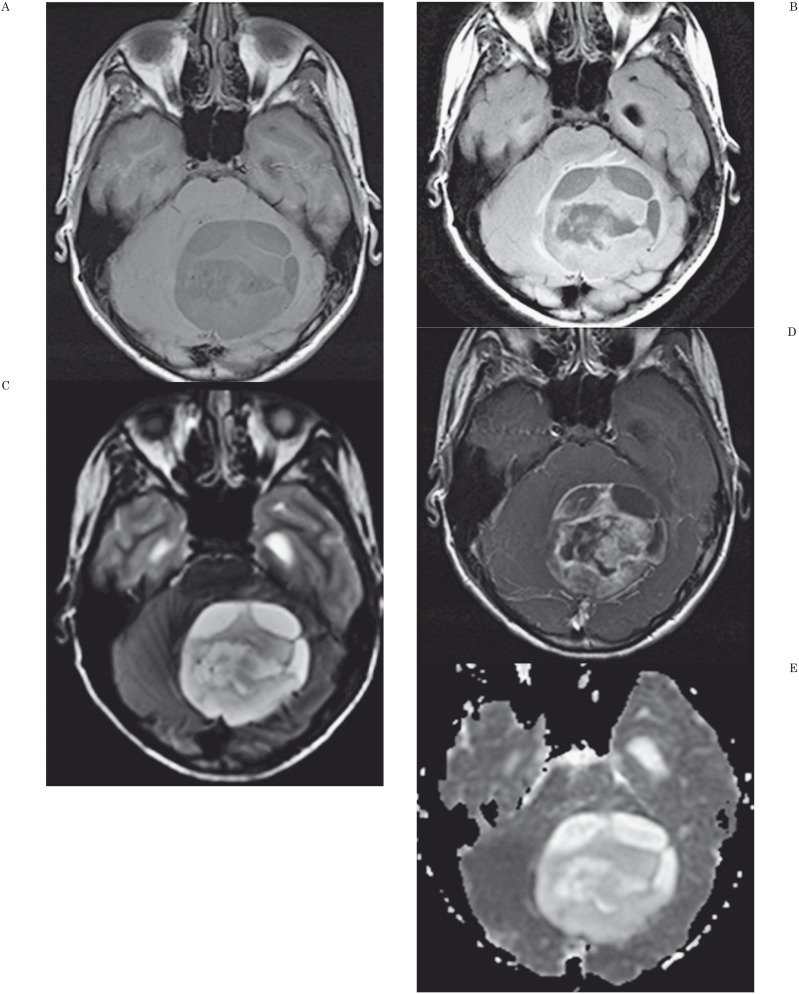
Figure 3.
MR Findings and ADC map in a 14-year-old boy with a cerebellar astrocytoma. A) Axial unenhanced T1-weighted image shows a large, inhomogeneous posterior fossa mass. B) Axial fluid-attenuated (FLAIR) image shows the mass to have cystic components and to cause obstructive hydrocephalus. C) Axial T2-weighted image shows a complex arrangement of cystic and solid portions of the mass. D) Axial contrast-enhanced T1-weighted axial image shows dense, inhomogeneous contrast enhancement of the mass. E) Axial apparent diffusion coefficient map shows the tumor has mildly increased signal intensity compared to adjacent normal brain. ADCmin was 1.64 × 10⁻³ mm2/s and nADC value was 2.03. The threshold values used in our study would correctly predict that this is not a medulloblastoma.

