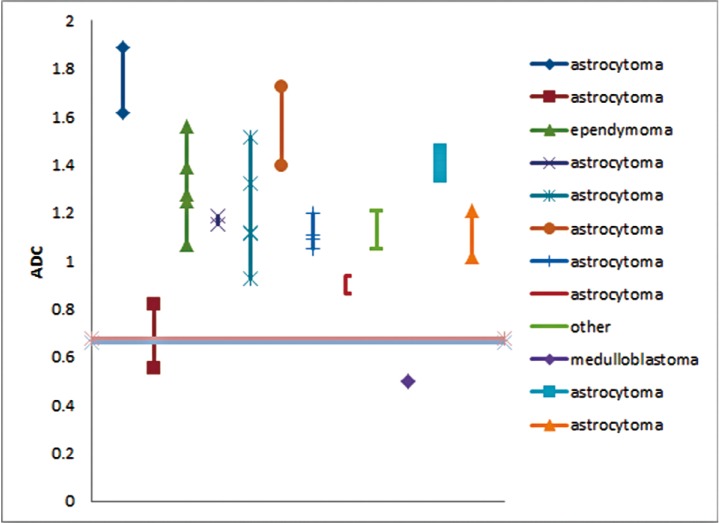
Figure 5.
Similarity of ADCmin measurements obtained on serial MR examinations. Minimum tumor ADC (ADCmin) values are plotted for each patient with multiple DWI examinations. Only one patient had variation in ADCmin that would have crossed the threshold shown as a horizontal line. Thus only one case would be categorized differently using ADCmin based upon the time of imaging. No general trend of ADCmin variation was seen over time.

