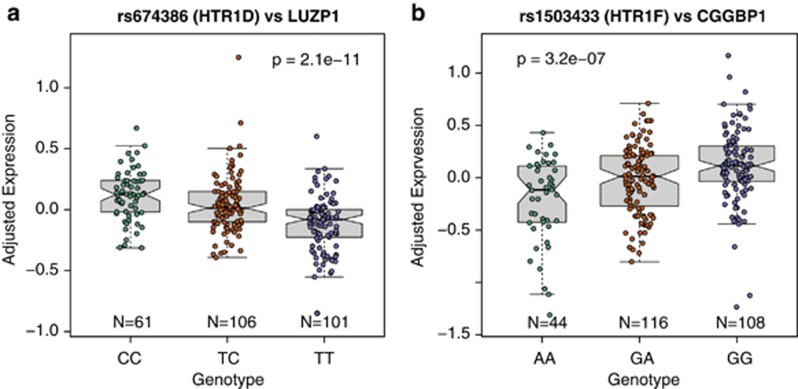
Figure 1.
Top expression quantitative trait loci (eQTLs) of ED clinical risk variants associated with gene expression in nonpsychiatric controls (N=268). (a) The effect of SNP rs674386 on LUZP1 expression and (b) the effect of rs1503433 on CGGBP1 expression. Y axis is log2 expression relative to a reference pool, adjusted for surrogate variables, sex and race.

