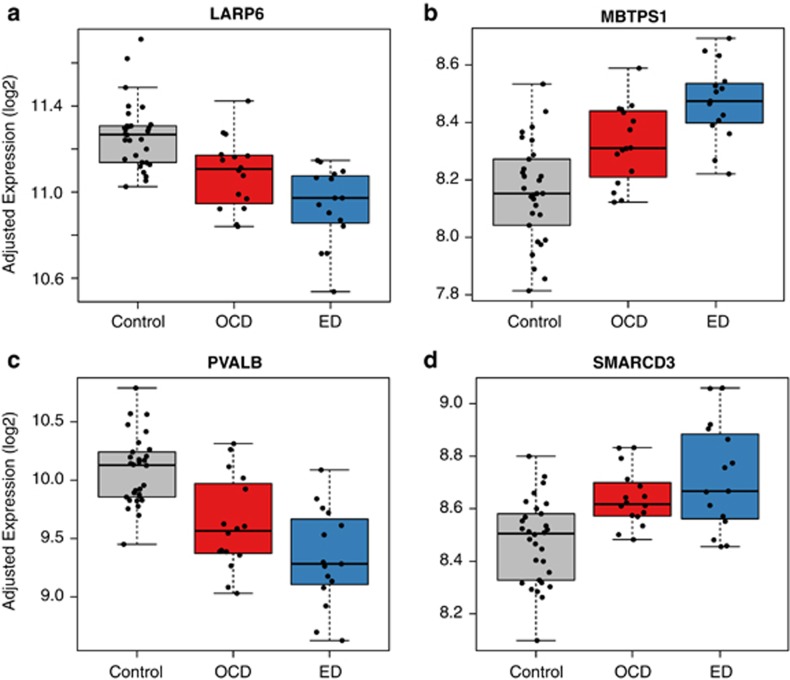
Figure 2.
Significant differentially expressed genes for eating disorder cases compared with controls for (a) LARP6, (b) MBTPS1, (c) PVALB, and (d) SMARCD3. Note that OCD cases have expression levels between controls and ED cases at these genes. Y axis represents log2 expression, adjusted for estimated surrogate variables and sex. ED, eating disorder; OCD, obsessive-compulsive disorder.

