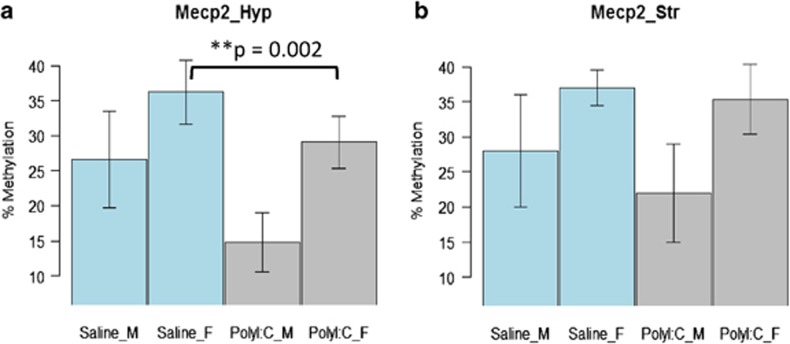
Figure 1.
Hypomethylated Mecp2 promoter in the hypothalamus of PolyI:C-exposed offspring. y axis shows methylation in percentage with error bar as s.e.m., histograms represent saline- and polyI:C-treated male and female groups. (a) Mecp2 promoter methylation in the hypothalamus of polyI:C- and saline-exposed male and female groups. (**P-value is calculated from a stratified t-test between saline- and polyI:C-affected females). (b) Mecp2 promoter methylation in the striatum of polyI:C and saline-exposed male and female groups.

