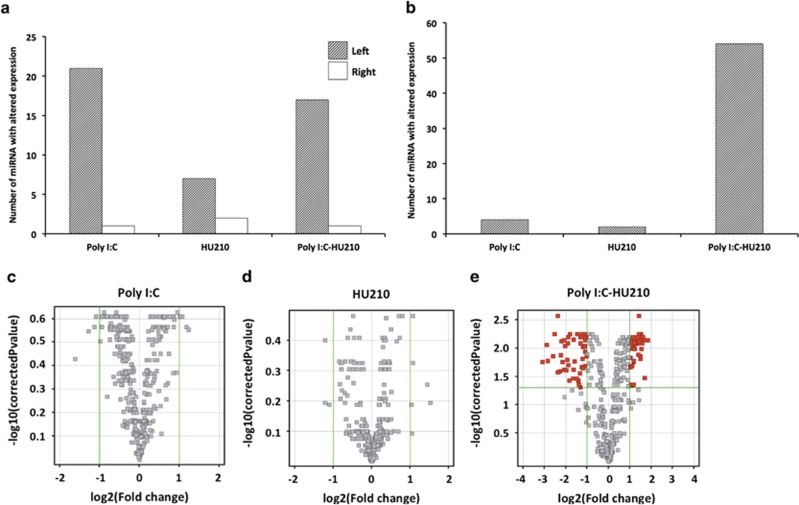
Figure 1.
Differential expression of miRNAs in the entorhinal cortex (EC). (a) The number of significantly differentially expressed miRNA (fold-change 0.5⩽ and ⩾2, P<0.05) in the left and right hemispheres of the EC following treatment as compared with non-treated controls. (b) The number of significantly differentially expressed miRNA (fold change 0.5⩽ and ⩾2, P<0.05) in the left hemisphere as compared with the right hemisphere of the EC, following treatment with poly I:C alone, HU210 alone and a combination of both. (c–e) Volcano plots comparing miRNA expression in specific treatment groups in the left hemisphere as compared with the right. miRNAs with a twofold difference (P<0.05) are shown in logarithmic scale (log2). miRNAs that were changed are represented as dark-red squares, in top-left (downregulated) and top-right (upregulated) parts of each figure. (c) Poly I:C-only-treated animals. (d) Rats exposed to HU210 alone in adolescence. (e) Poly I:C-treated animals that were also exposed to HU210 during adolescence.

