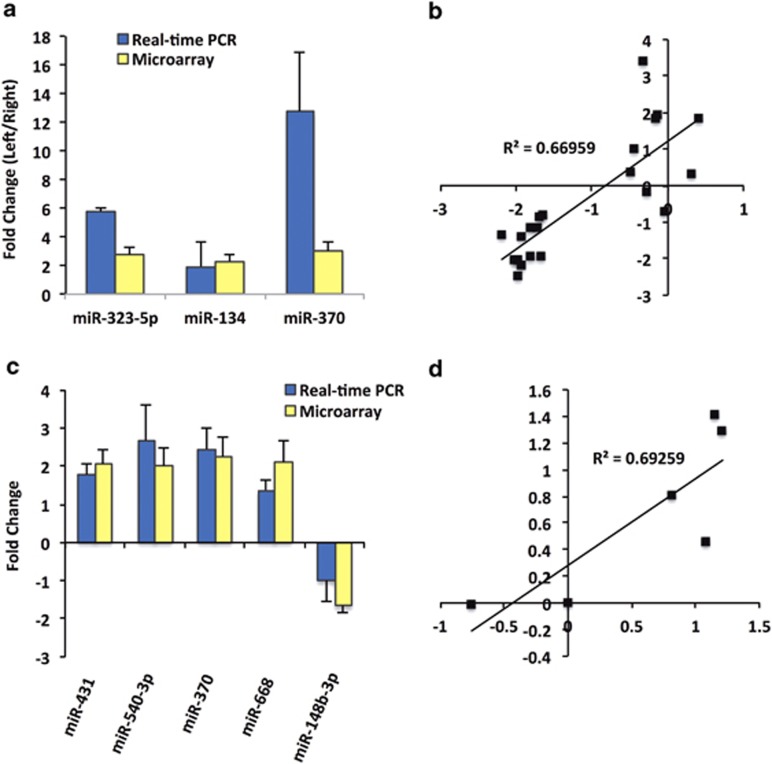
Figure 2.
Real-time PCR validation of miRNA microarrays. (a, c) miRNA expression as a result of maternal immune activation (MIA) with subsequent adolescent exposure to cannabinoid treatment. Data are expressed as a ratio of (a) left to right hemispheres and (c) treatment as compared with controls. miRNA expression as determined using microarray appear as yellow bars and reverse transcriptase (RT)-PCR results appear as blue bars. For RT-PCR, relative miRNA expression was determined by the difference between their individual cycle threshold (Ct) value and the geometric mean for the U6 and SNORD95 snRNA (ΔCt). These constitutively expressed small RNAs are not structurally associated with the large small nucleolar RNA (snoRNA)/miRNA cluster at 6q32. Microarray and RT-PCR data arose from five and three biological replicates, respectively. Bars are mean±s.e.m. (b) Microarray data (a) were validated using RT-PCR with a correlation coefficient of 0.67 (P<0.0001). (d) Microarray data (c) were validated using RT-PCR with a correlation coefficient of 0.69 (P<0.05).

