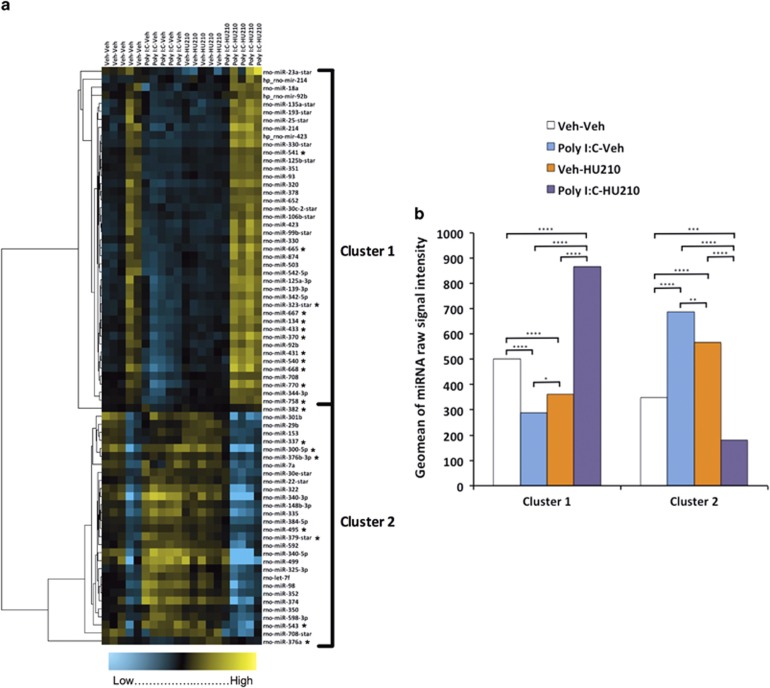
Figure 3.
Hierarchical clustering of differentially expressed miRNA. (a) Expression data of miRNA differentially expressed in the left hemisphere of the entorhinal cortex (EC) following treatment (n=5 per group) were subjected to hierarchical clustering (correlation uncentred, average linkage; Cluster 3.0). Blue indicates low expression and yellow indicates high expression. * denotes differentially expressed miRNA located on 6q32. Produced with Java Treeview 1.1.6r2 (http://jtreeview.sourceforge.net).56 (b) Expression trends of miRNA within Clusters 1 and 2. For display purposes, expression was derived by calculating the geomean of signal intensity values for all miRNAs within each treatment group. All data were analysed for significance by two-way analysis of variance (ANOVA), followed by Tukey–Kramer's post hoc t-testing (*P<0.05, **P<0.01, ***P<0.001 and ****P<0.0001).

