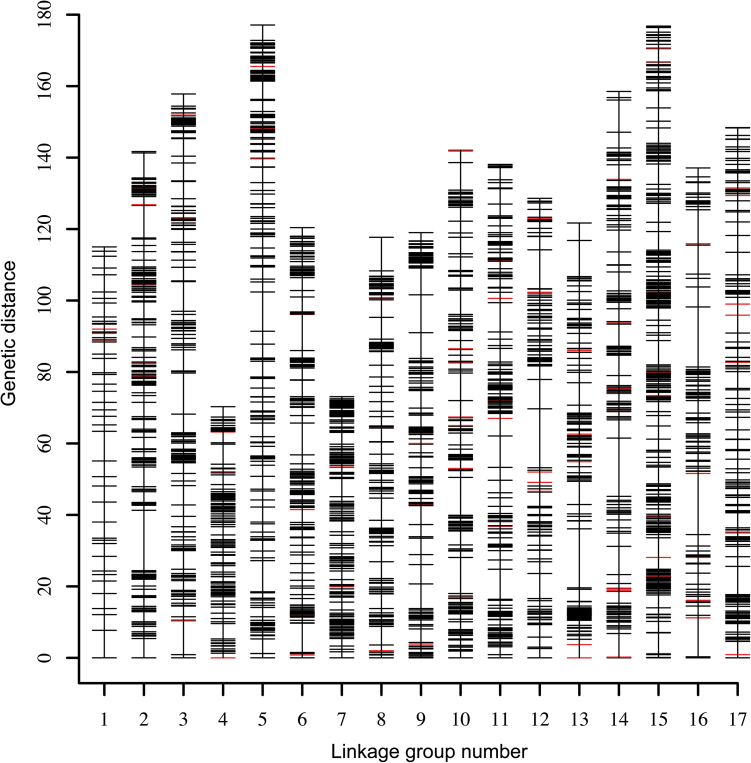
Fig. 1.
Distribution of SNP and SSR markers on 17 Linkage groups. A black bar indicates a SNP marker, and a red bar indicates an SSR marker. Linkage group number is shown on the x-axis and genetic distance is shown on the y-axis (centiMorgan as unit). (This figure is available in colour at JXB online.)

