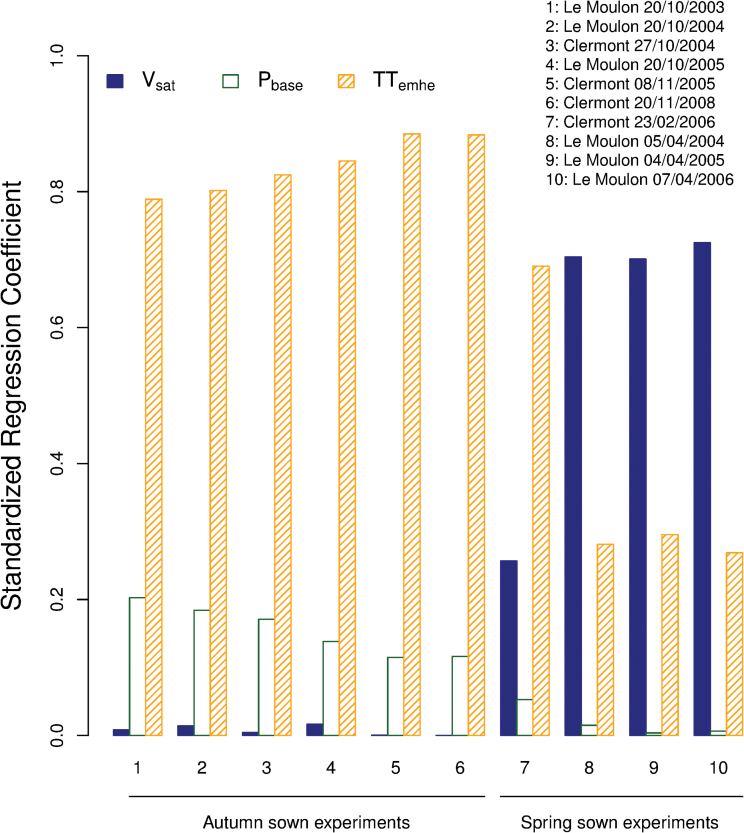
Fig. 1.
Sensitivity analysis of a modified version of the Weir et al. (1984) phenological model. Standardized regression coefficients showing the percentage of variation of heading date explained by each model parameter (V sat, P base, and TT emhe) were calculated in each autumn- and spring-sown experiment used to optimize the model for the genotypes of the calibration data set. This figure is available in colour at JXB online.

