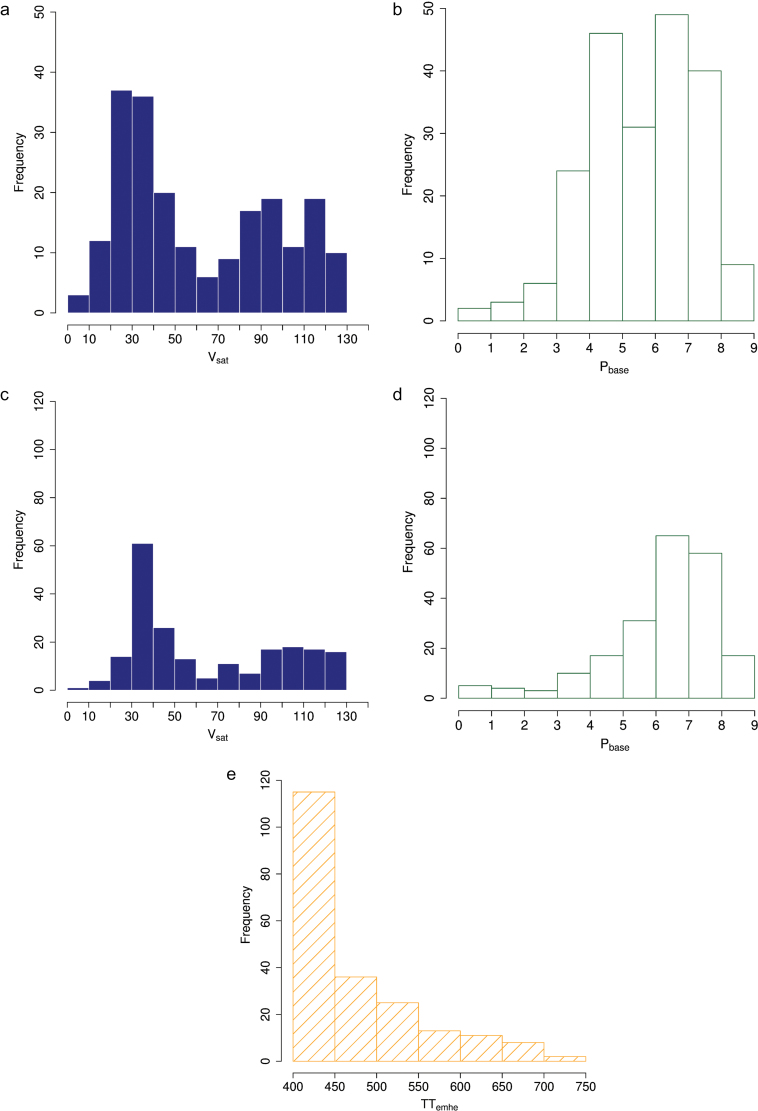
Fig. 2.
Distributions of the V sat (a, c), P base (b, d) and TT emhe (e) parameters of a modified version of the Weir et al. (1984) phenological model optimized for the 210 genotypes of a wheat-association genetics panel when two (V sat and P base; a, b) or three (V sat, P base, and TT emh; c, d, and e) parameters were optimized. This figure is available in colour at JXB online.

