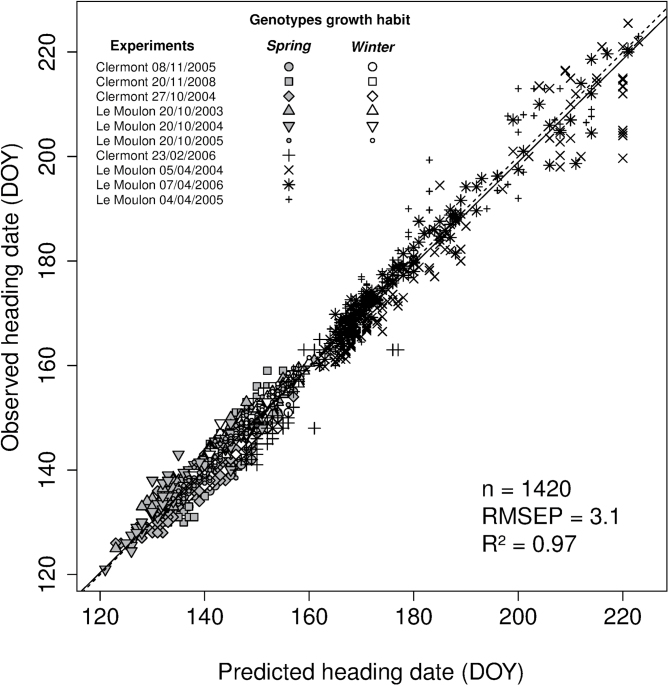
Fig. 3.
Relationship between observed and predicted heading dates obtained with two optimized parameters (2p strategy) of a modified version of the Weir et al. (1984) phenological model for a wheat calibration data set grown in 10 location × sowing date combinations. Autumn- and spring-sown experiments are shown with closed symbols and stars, respectively. Winter genotypes headed only in autumn-sown experiments while spring genotypes headed in autumn- and spring-sown experiments. Symbols for autumn-sown experiments are filled in white and grey for winter and spring genotypes, respectively. Linear regression (solid) and bisecting (dashed) lines are shown. The number of data points (n), the percentage of variance explained (R2) and RMSEP are indicated.

