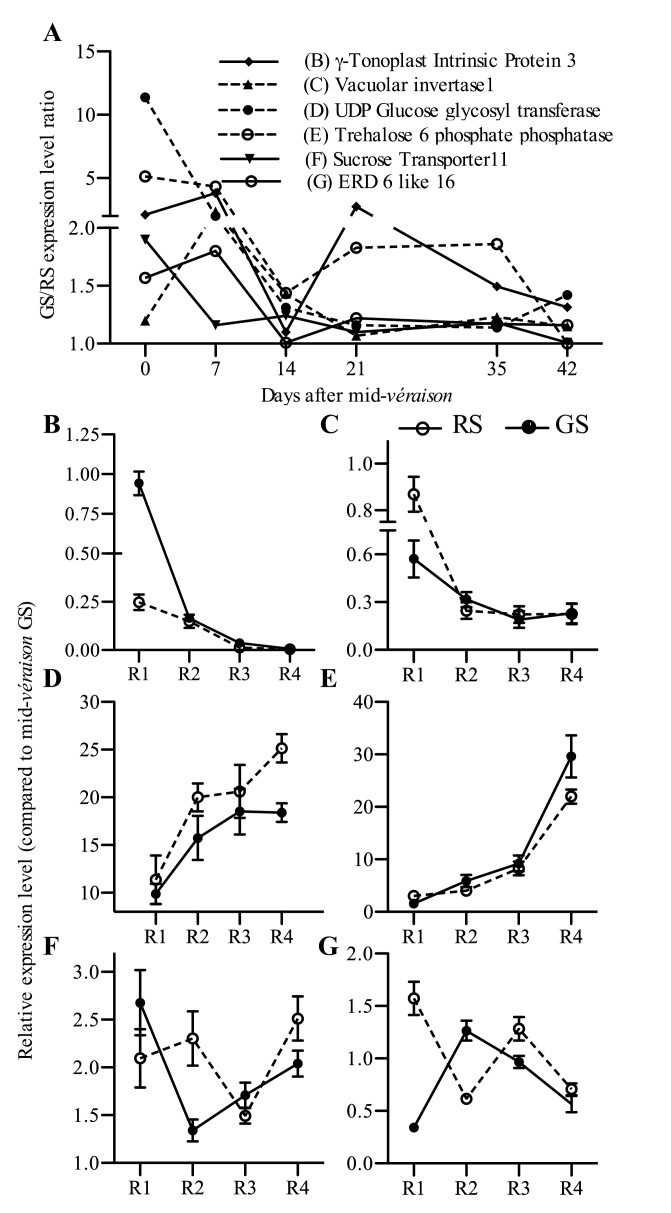
Fig. 7.
Differential gene expression dynamics in GS and RS berry classes. (A) Relative expression levels of six genes in GS and RS berries measured at mid-véraison (V) and at 7, 14, 21, 35, or 42 d after V expressed as the GS to RS ratio. (B–G) Gene expression levels and progression of transcription of the same genes in GS (filled circles) and RS (open circles) berry classes at R1, R2, R3, and R4 equivalent stages (Supplementary Table S5 at JXB online). Error bars indicate ±SEM of six replicates. Expression of the genes was measured in pulp tissue. See Supplementary text at JXB online for Gene IDs.

