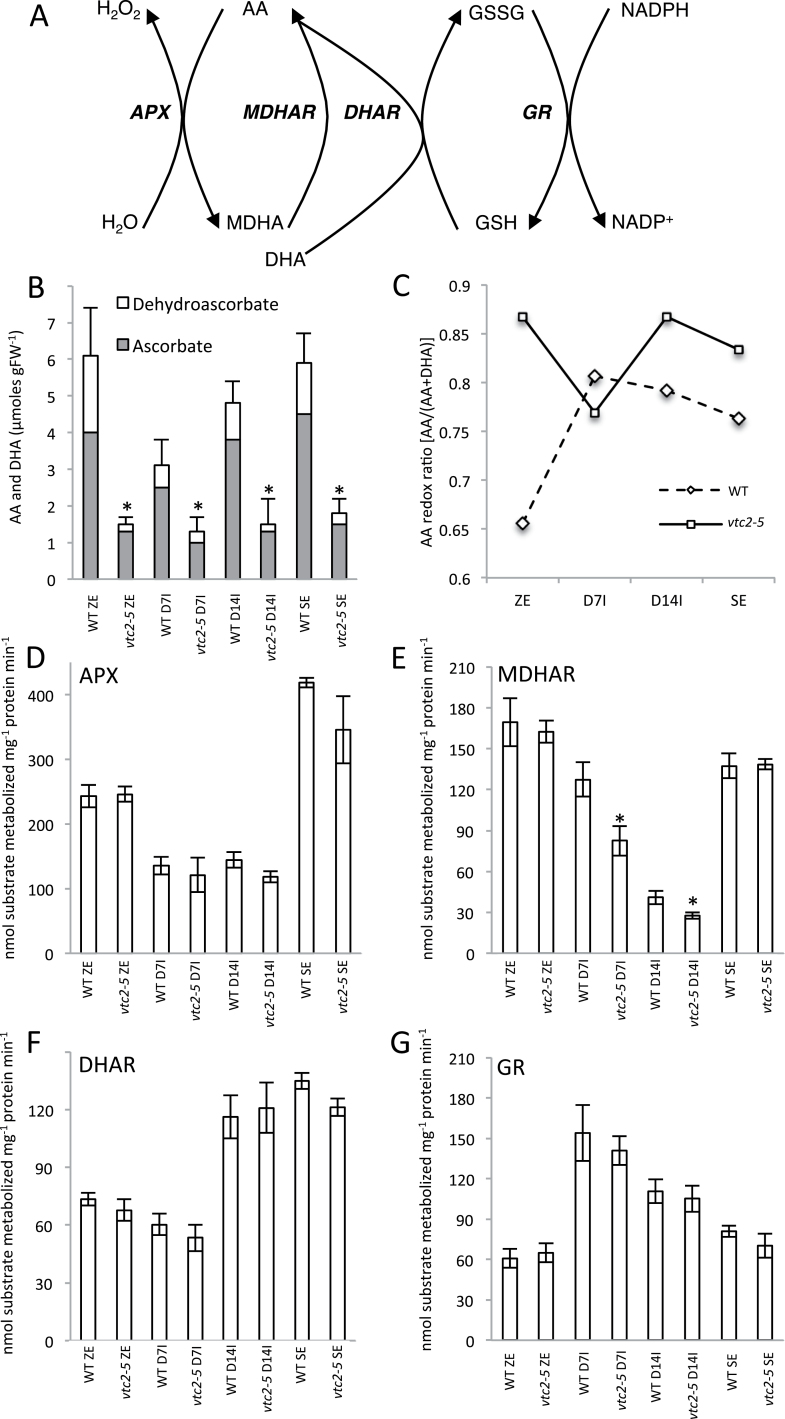
Fig. 2.
Effect of AA deficiency on cellular redox status during SE in WT Col-0 and vtc2-5. (A) Schematic diagram of the ascorbate–glutathione cycle. APX, ascorbate peroxidase; ASC, ascorbic acid; DHA, dehydroascobate; MDHA, monodehydroascorbate; MDHAR, monodehydroascorbate reductase; DHAR, dehydroascorbate reductase; GSH, glutathione; GSSG, glutathione disulfide; GR, glutathione reductase. (B) Endogenous cellular levels of AA and DHA during somatic embryogenesis. (C) AA redox ratio throughout somatic embryogenesis. (D) Cellular levels of APX. (E) MDHAR levels. (F) Cellular levels of DHAR. (G) Endogenous levels of GR during somatic embryogenesis. Asterisks above bars indicate a significant difference from WT control values (P<0.05) at the same sampling time.

