Fig. 4.
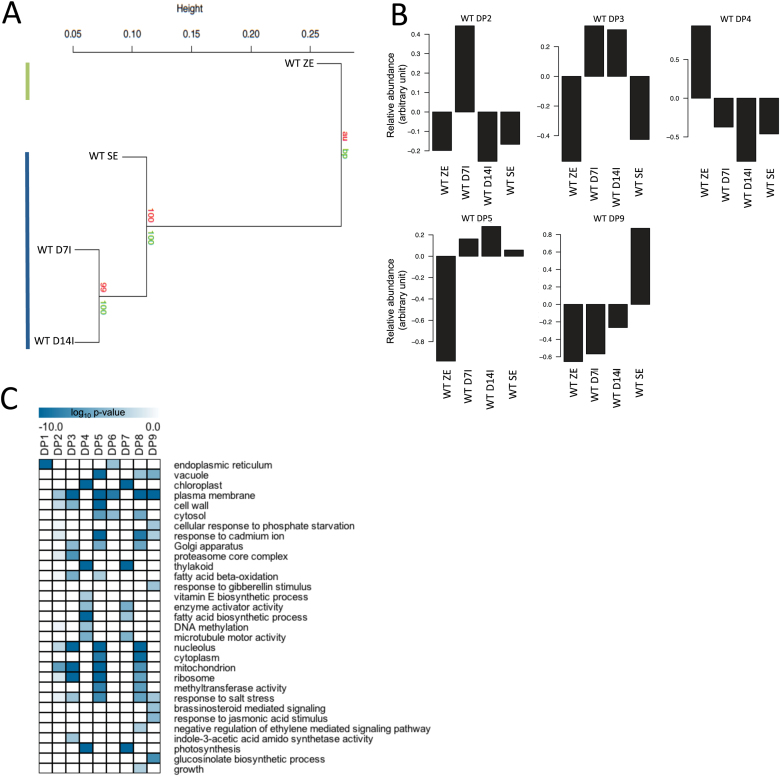
Transcriptome analysis of WT SE. (A) Global hierarchical clustering of whole GeneChip data across all stages of SE. Two distinct groups were apparent. First, for the bent-cotyledon stage of ZE (top left line) and secondly for SE (bottom left line). Bootstrap values are shown below the node and approximately unbiased values are shown above the node. (B) DPs of gene expression during WT SE. Selected clusters showed differential patterns of gene expression. Individual bars represent the relative abundance of mRNAs clustered into each DP at all stages of development. Five selected patterns are shown. (C) GO term enrichment analysis showcasing selected statistically enriched biological processes present in sets of genes from the clustering analysis. Selected GO terms are presented using a heatmap generated in TMeV (a complete list of GO terms is found in Dataset S2). GO terms are considered enriched at p < 0.001 where a darker colour represents a more statistically enriched term. (This figure is available in colour at JXB online.)

