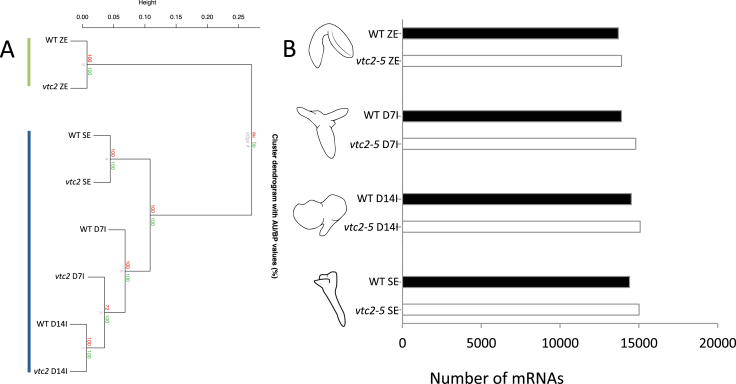
Fig. 5.
(A) Hierarchical clustering of WT and vtc2-5 tissues during SE. Clustering analysis revealed two distinct groups: (i) bent-cotyledon zygotic embryos (top left line); and (ii) somatic embryos, including D7I, D14I and mature somatic embryos (bottom left line). (B) Number of mRNAs in WT and vtc2-5 tissues during SE. A complete list of the mRNAs and their levels are given in Dataset S1. (This figure is available in colour at JXB online.)

