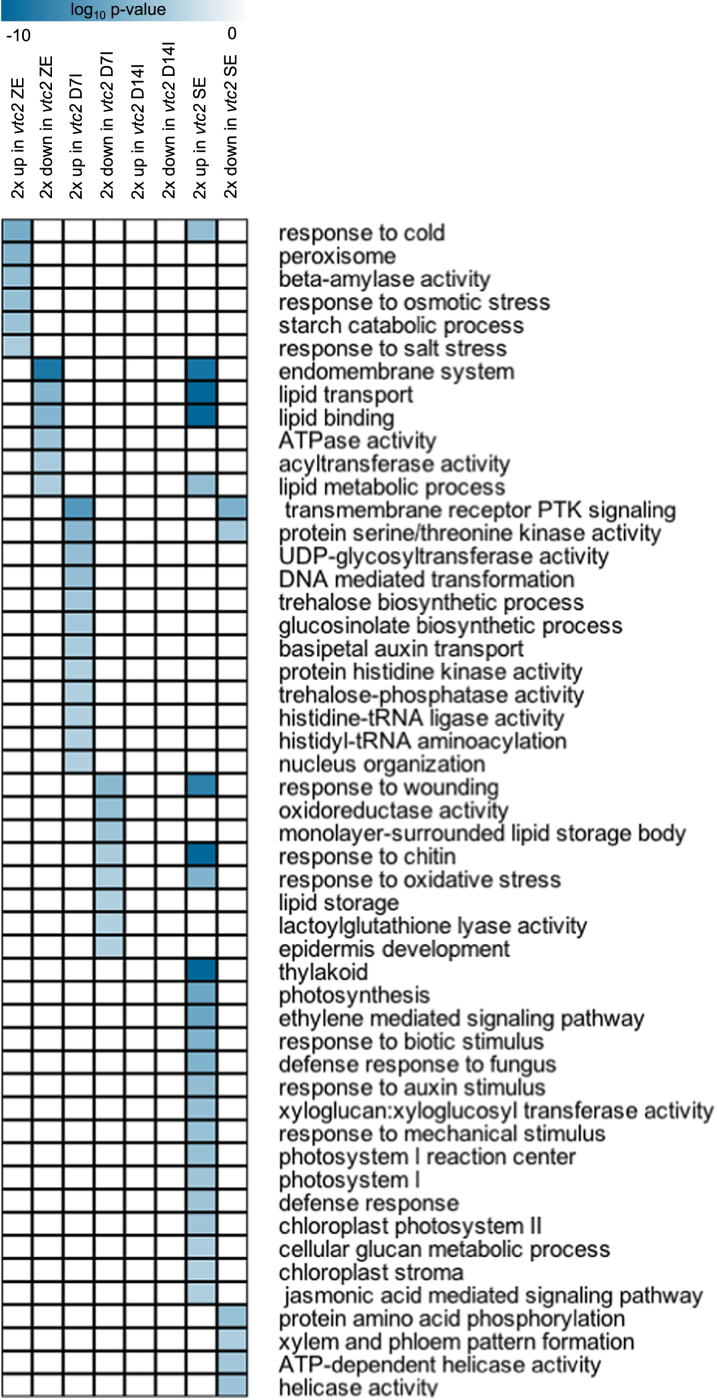
Fig. 6.
Selection of statistically enriched GO terms (P<0.001, hypergeometric distribution) in sets of genes that were >2-fold up- or downregulated in the vtc2-5 mutant compared with the WT at each stage of SE. A complete list of all enriched GO terms is given in Supplementary Dataset S2. A darker colour represents greater statistical enrichment. (This figure is available in colour at JXB online.)

