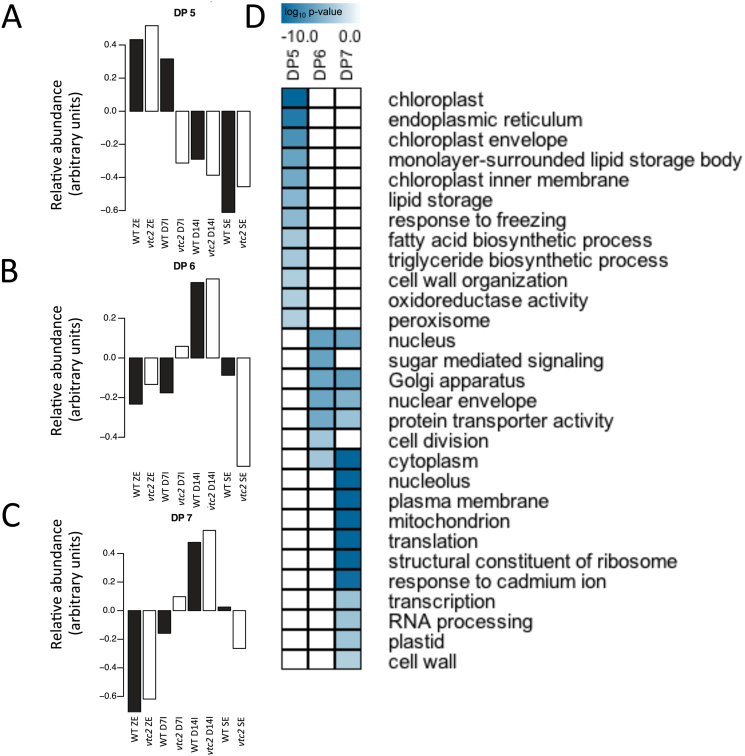
Fig. 8.
Identification of dominant patterns (DPs) of gene activity and functional categorization of genes differentially expressed between WT and vtc2 tissues. (A) DP5 showed that gene activity in WT (filled bars) D7I was more like that of zygotic embryos compared with vtc2-5 (open bars). (B) Accelerated gene activity in vtc2-5 at D7I (DP6). (C) Accelerated gene activity during SE induction in vtc2-5 (DP7). Thirteen DPs were identified using a modified FKM analysis with a Pearson correlation cut-off value of 0.85. A complete list of the mRNAs belonging to each DP is given in Supplementary Dataset S1. (D) Representative GO terms corresponding to DP5, DP6, and DP7. The listed GO terms were statistically enriched (P<0.001, hypergeometric distribution) between vtc2-5 and WT tissues. A complete list of all enriched GO terms is given in Supplementary Dataset S2. A darker colour represents more statistically enriched GO terms. (This figure is available in colour at JXB online.)

