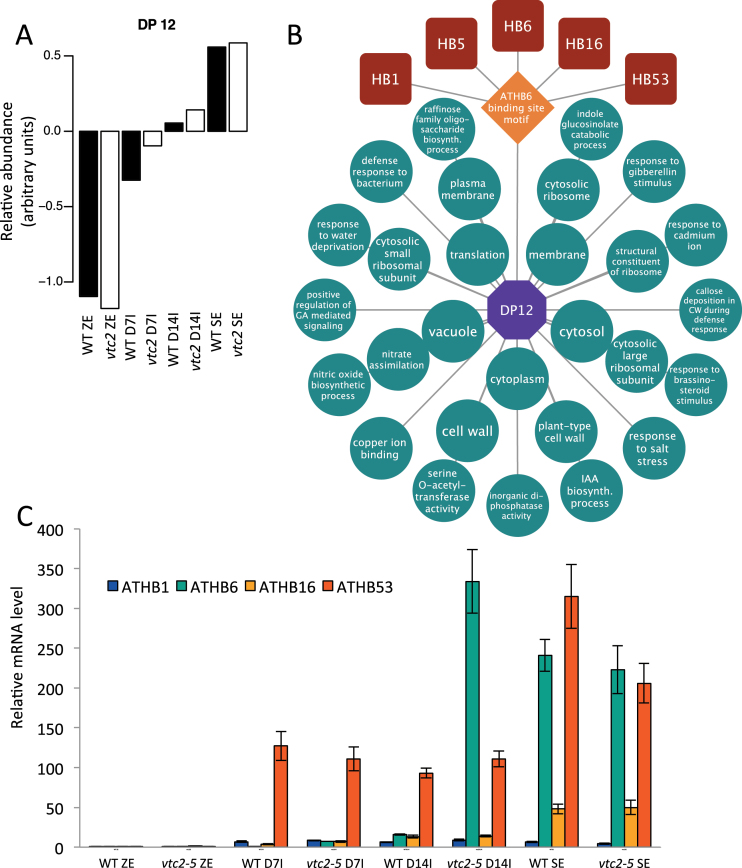
Fig. 9.
Predicted gene regulatory network controlling somatic embryo development. (A) DP12 showing the relative mRNA levels during SE in both WT and vtc2 tissues. (B) Predicted homeobox-regulated transcriptional module underlying somatic embryo development. (C) Quantitative PCR showing increased levels of ATHB1 (ARABIDOPSIS THALIANA HOMEOBOX 1), ATHB6, ATHB53, and ATHB16 in somatic embryo tissues. (This figure is available in colour at JXB online.)

