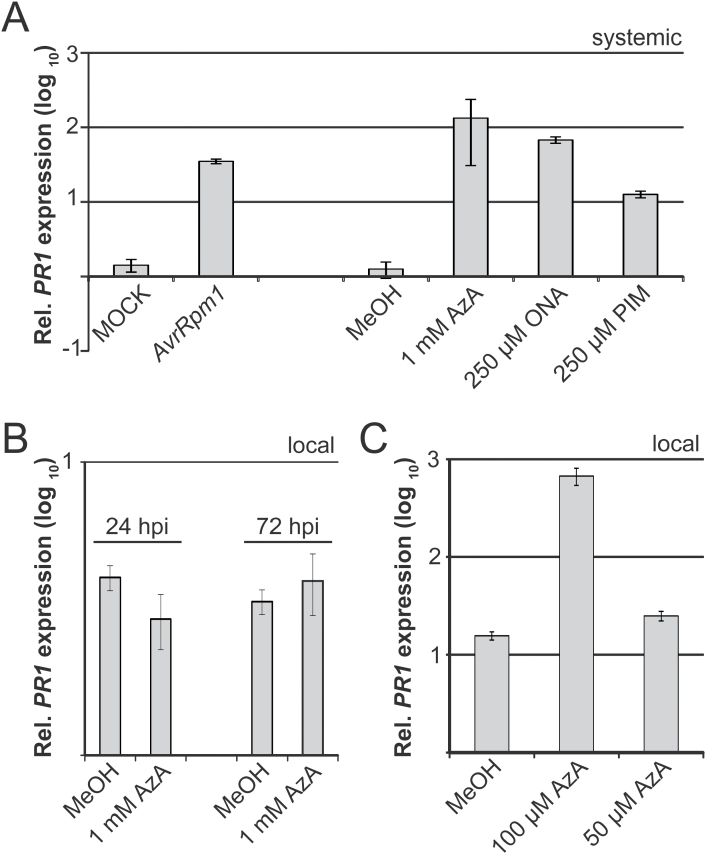
Fig. 6.
PR1 transcript accumulation in response to ONA, AzA, or PIM application (A) Systemic PR1 induction. Plants were locally treated with 10mM MgCl2 (MOCK), Pst/AvrRpm1 (AvrRpm1), 0.1% MeOH, 1mM AzA, 250 μM ONA, or 250 μM PIM. Three days later, PR1 transcript accumulation in systemic untreated leaves was analysed by qRT–PCR and normalized to that of the reference gene TUBULIN. The normalized expression is shown relative to that in leaf tissue from untreated Col-0 plants. (B, C) Local PR1 transcript accumulation in leaves treated with 0.1% MeOH or AzA at different concentrations as indicated below the panels. PR1 transcript accumulation was analysed as in (A) and samples were taken at the time points indicated in (B) or at 72 hpi (C). These experiments were repeated at least three times with similar results. Rel., relative; hpi, hours post-infiltration

