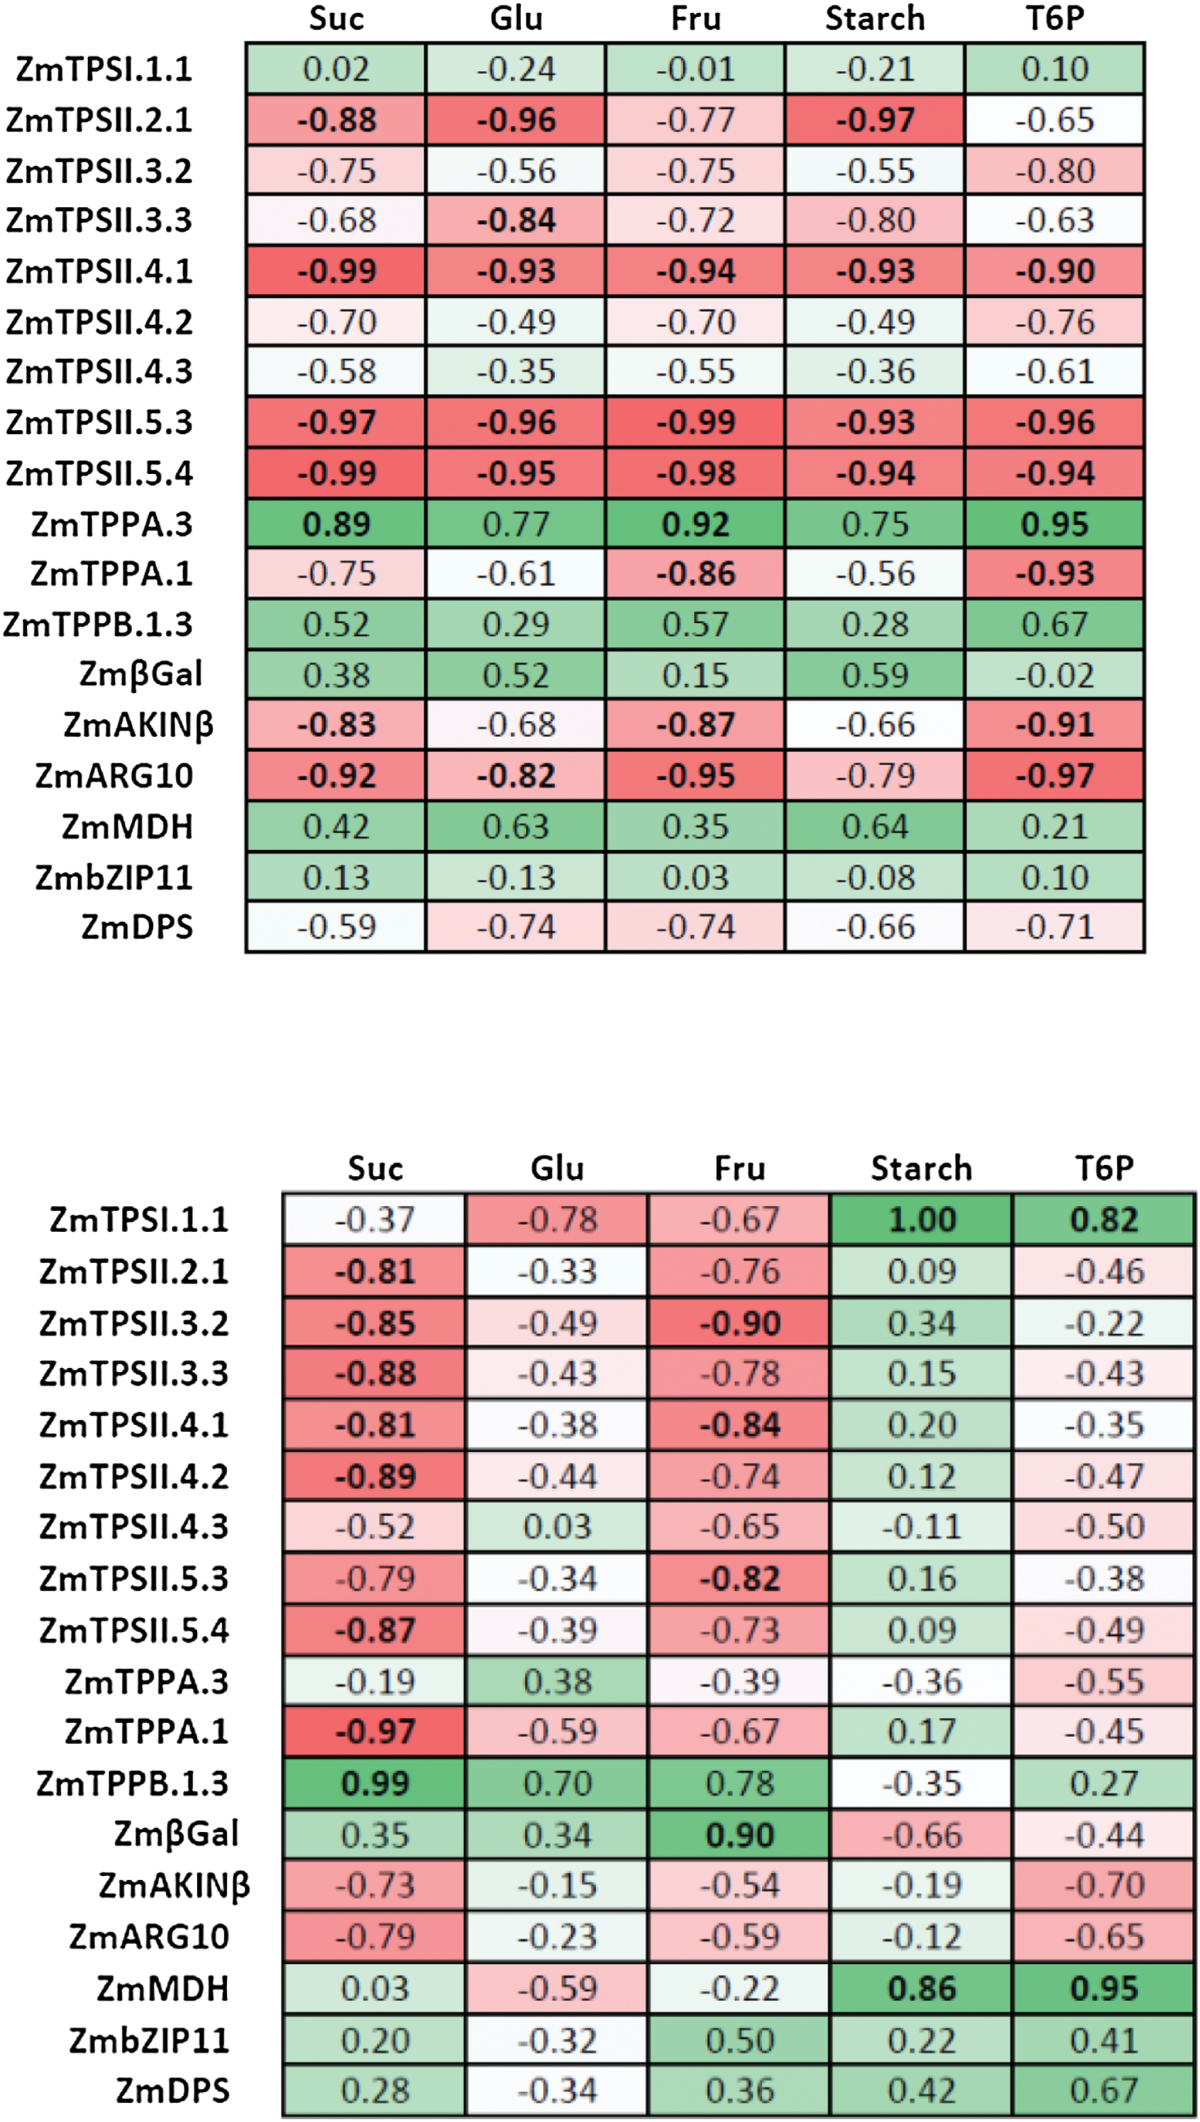
Table 4.
Correlation coefficients between transcripts and sugarsCoefficients of correlation were determined over 24h after control (top) and dark (bottom) treatment using a Pearson comparison test (n=3–6). Positive and negative correlations are indicated in shades of green and red, respectively.

