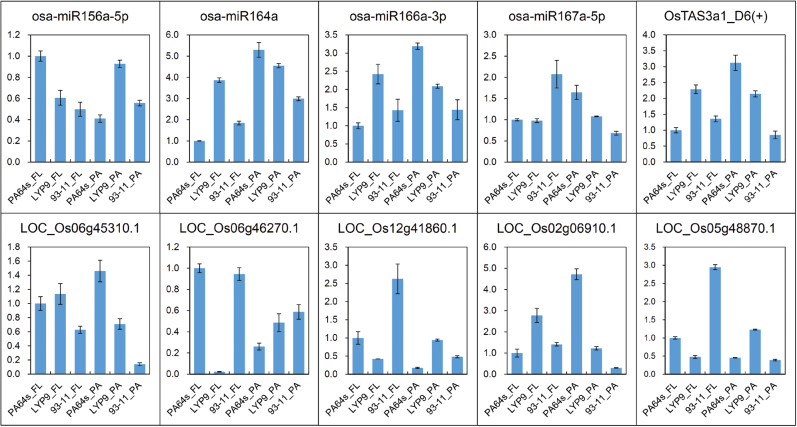
Fig. 6.
qRT-PCR analysis of DES and target genes. U6 snRNA and ACT1 were used as internal references for the qRT-PCR of DES mature sequences and target gene transcripts (corresponding vertical lower figure), respectively. The y-axis represents the relative gene expression level in different samples. Error bars indicate the standard deviation (SD) for three biological replicates. FL, flag leaves. PA, panicles.

