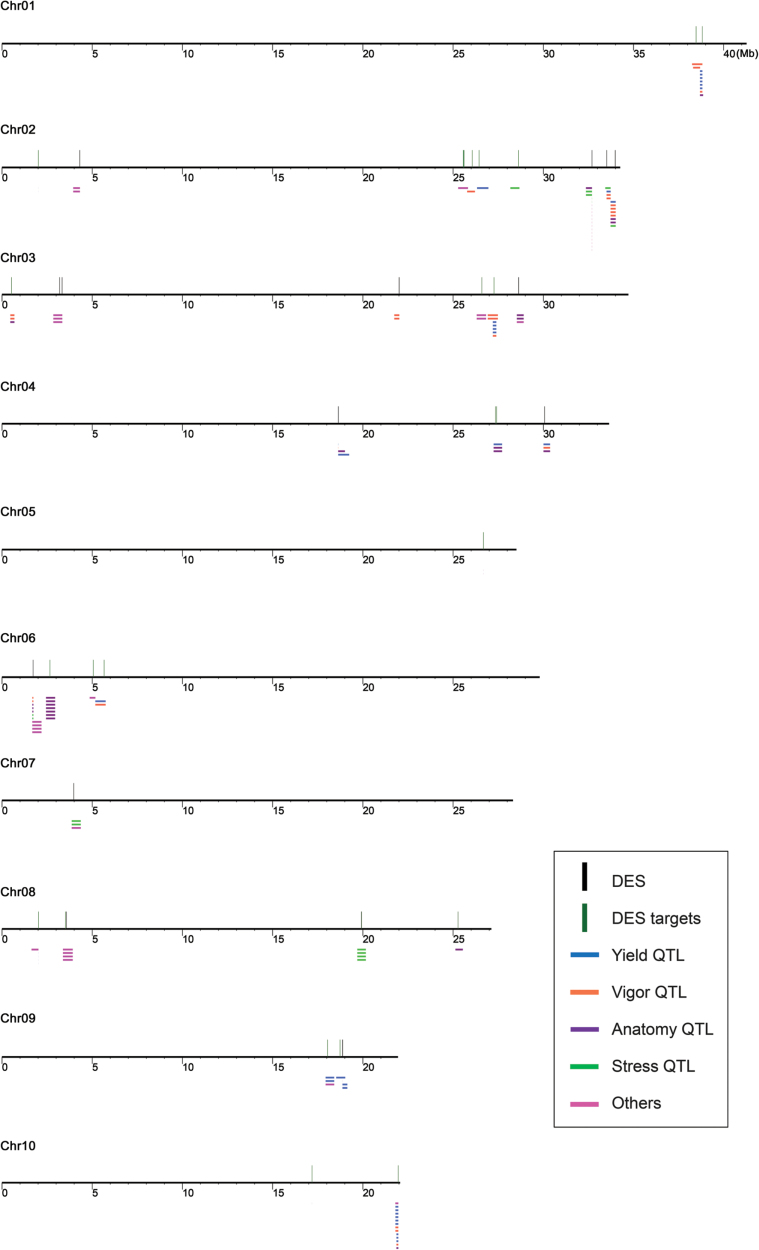
Fig. 8.
QTL mapping of DES and target genes. The rice QTL from the Gramene QTL database of small intervals (number of genes <100) that harbour DES and the target genes were aligned with the gene coordinates in MSU rice genome release 6. The long horizontal lines represent the rice chromosomes with the scale in Mb, the short horizontal lines represent QTL intervals of different trait categories in different colours, and the short vertical lines represent DES and targets in black and green, respectively. Five classes of QTL traits wee determined: yield, vigour, anatomy, stress (biotic and abiotic stress), and others (biochemical, development, quality, and sterility or fertility).

