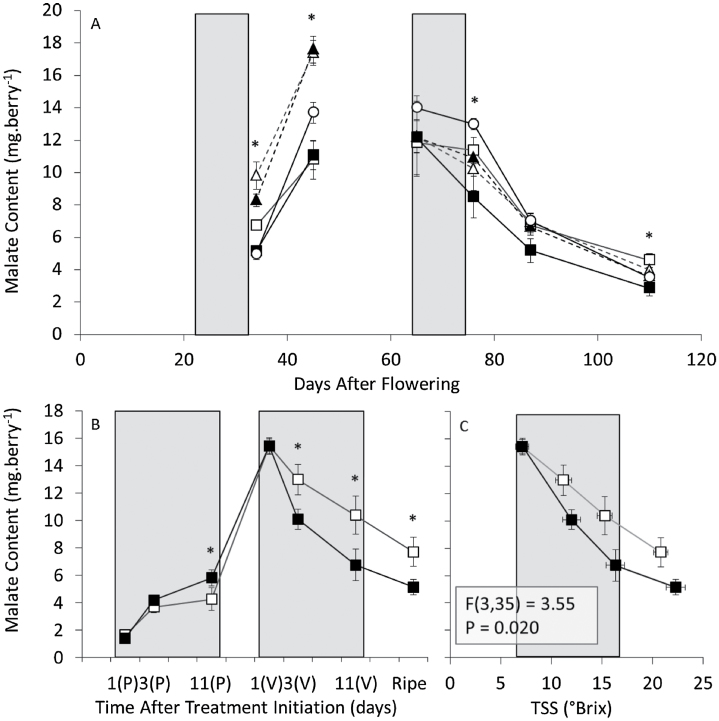
Fig. 2.
Berry malate content following eleven-day elevated temperature treatments applied at pre-véraison and véraison stages (Experiments 2 and 3). (A) Malate content of berries from Experiment 2 external controls (open circles), control treatments (open squares), heated days (closed squares), heated nights (open triangles), and heated days and nights (closed triangles) for pre-véraison and véraison treatments. (B and C) Malate content from berries of Experiment 3 for control (open squares) and heated (closed squares) vines, plotted against (B) chronological time (days after the initiation of pre-véraison [P] and véraison [V] treatments) and (C) TSS (°Brix) for the véraison treatment. Treatment periods are highlighted in grey. [Samples taken from the final four time-points of (B) and (C) were used for the metabolite analysis shown in Fig. 7]. n=8±SD. *Significantly different from samples subjected to the control treatment (independent t-test, P<0.05). For (C), the overlay of the curves for control and heated berries was determined by nonlinear regression with least squares.

