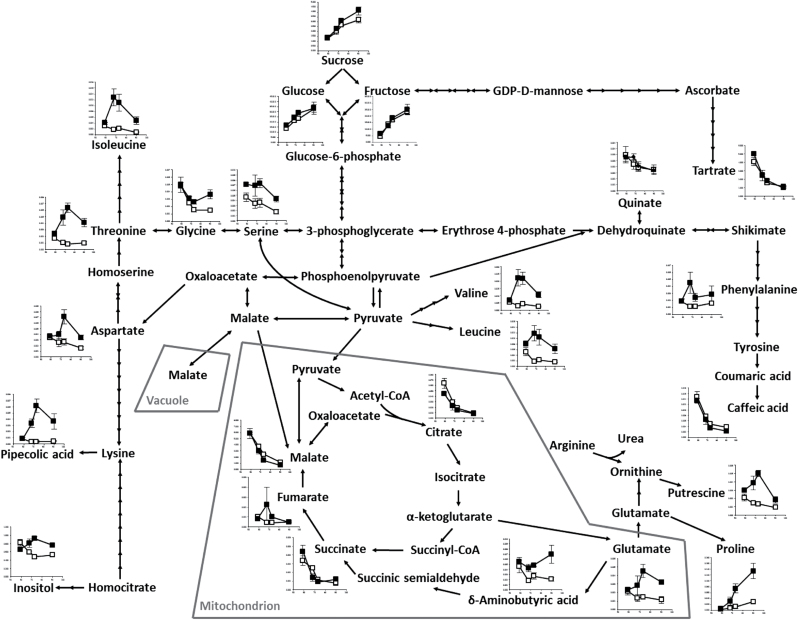
Fig. 7.
Metabolite pools following an eleven-day elevated-temperature treatment of potted Shiraz vines applied at véraison (Experiment 3). Time-series graphs demonstrate relative concentrations (to internal standard, ribitol) of compounds within control (open squares) and heated (closed squares) berries from (I) the first day of treatment, (II) the third day of treatment, (III) the final day of treatment and (IV) harvest ripeness (i.e. samples taken at the final four timepoints of the véraison treatment as shown in Fig. 2B, C). n=4±SD.

