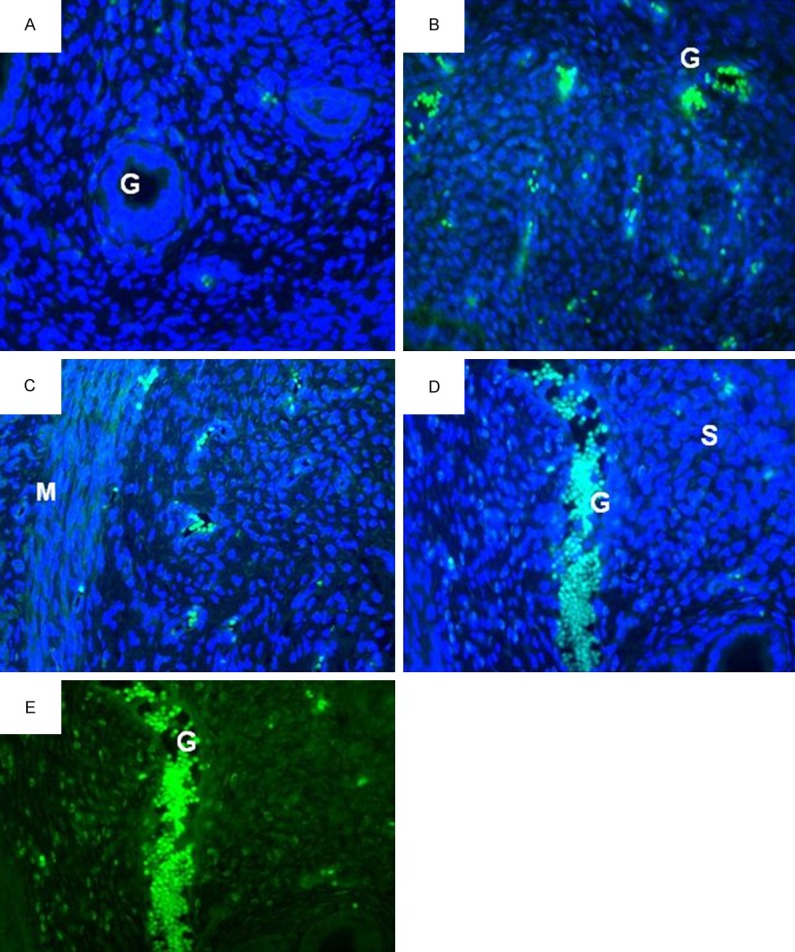
Figure 4.

PCNA distribution in the glands of different treatment groups. A-D: FTIC with DAPI staining and E: FTIC staining alone for PCNA. Fluorescence signal could be seen arising from the glands. The highest intensity could be seen arising from (E+P)+100Q group (D & E images). L, lumen; G, glands; S, stroma; M, myometrium. A = control, B = estrogen plus progesterone, C = estrogen plus progesterone with 10 mg/kg/day quercetin, D & E = estrogen plus progesterone with 100 mg/kg/day quercetin.
