
Figure 3.
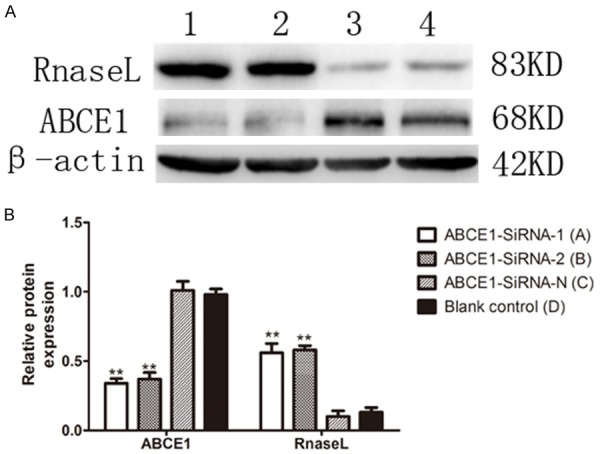
Expression of ABCE1 decreased while RNase L increased after transfection, β-actin served as control. A. Western blotting representation; B. The expression displayed by column chart. **P < 0.01, compared with blank control. Figure shows the width of the scratch in each time period of each group of cells. *P < 0.01, compared with group D and ABCE1-SiRNA-N group.