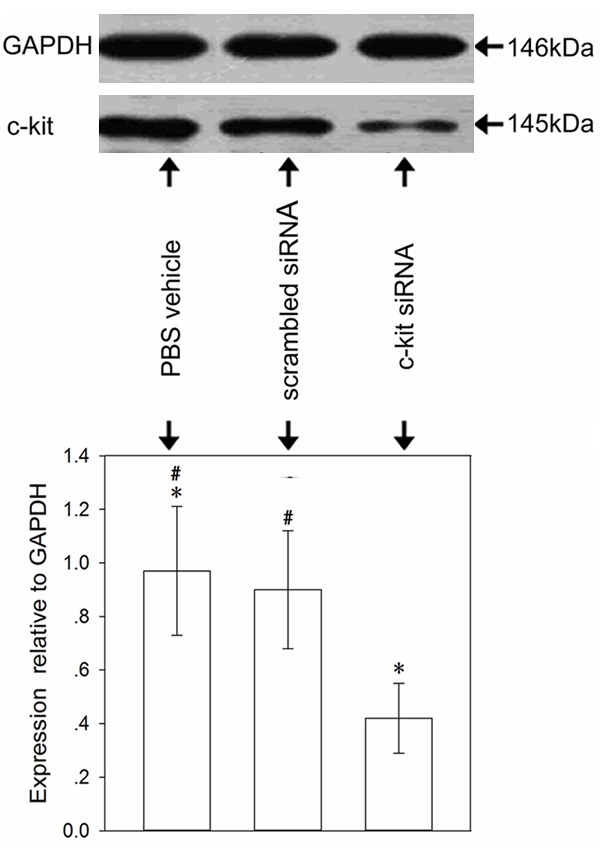
Figure 7.

Expression of c-kit protein in lung tissue. Histograms represent the mean relative amount (± SD) of the c-kit bands normalized to GAPDH. There was a difference between the anti-c-kit siRNA group and the other groups. *P < 0.05 vs. the control and scrambled siRNA groups. #P > 0.05 between the control and scrambled siRNA groups. The experiment was carried out three times; representative images are shown.
