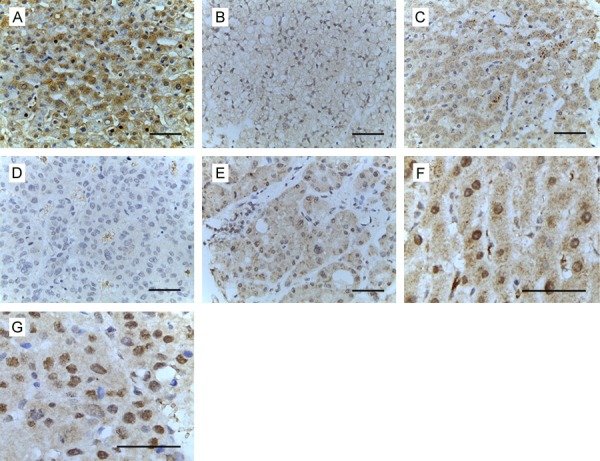
Figure 1.

Expression analysis of IGFBP-1 in HCC by immunohistochemistry (A-G). (A) Expression of IGFBP-1 in normal liver. (B) Low expression of IGFBP-1 in adjacent non-tumorous tissue. (C) High expression of IGFBP-1 in adjacent non-tumorous tissue. (D) Low expression of IGFBP-1 in HCC. (E) High expression of IGFBP-1 in HCC. (F) Nuclear expression of IGFBP-1 in adjacent non-tumorous tissue. (G) Nuclear expression of IGFBP-1 in HCC. Bar, 50 μm.
