
Figure 2.
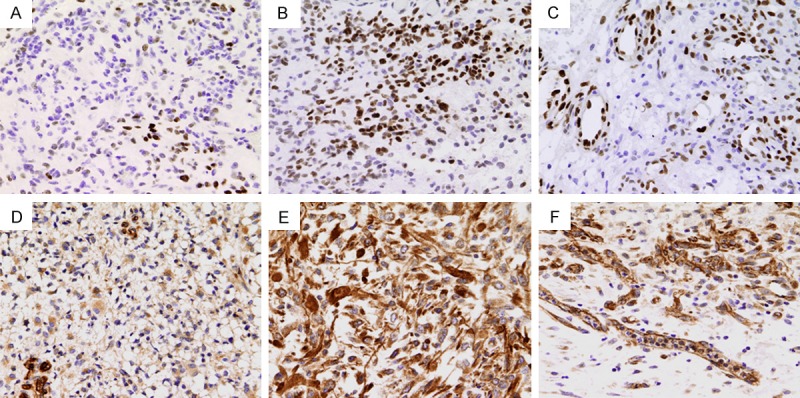
Immunohistochemical staining showing the expression of pSTAT3 (A-C) and VEGF (D-F) in GBM tissues. (A, B) Show low and high pSTAT3 expression, respectively; (D, E) Show low and high VEGF expression, respectively. Immunostaining is also seen in neovascular endothelial cells. (C, F) Show pSTAT3 and VEGF expression, respectively. Original magnification: × 400.