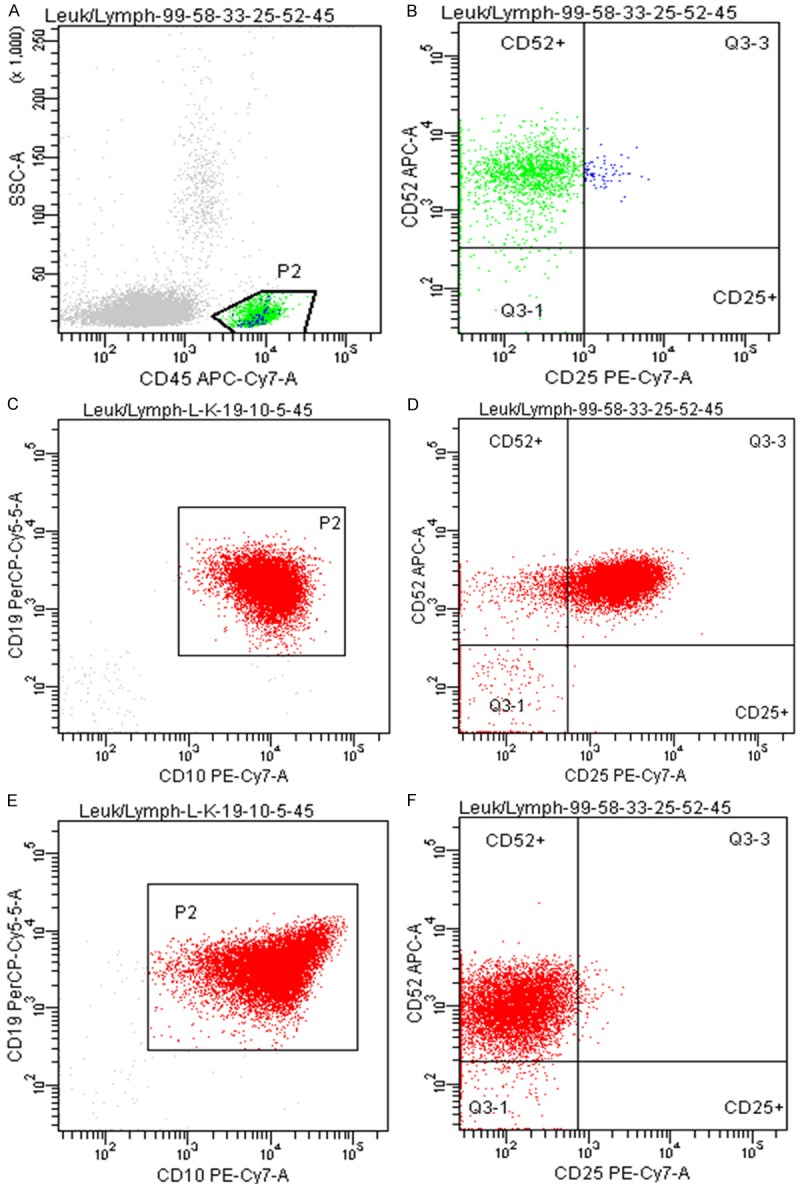
Figure 1.

Representative plots used in CD25 analysis. A, B: Gating strategy for CD25 analysis. A: Normal lymphocytes (P2) were gated on a CD45 vs side scatter dot plot. B: Normal lymphocytes (P2) from plot A show a sub-population (in blue) that expresses CD25. This quadrant is used to identify the percentage of gated blasts that express CD25. C, D: Representative example of positive CD25 expression in B-ALL (Ph-negative). C: Gated lymphoblasts (P2) shown on a CD10 vs. CD19 plot. D: 90% of the gated lymphoblasts express CD25, which is considered positive. E, F: Representative example of negative CD25 expression in B-ALL (Ph-negative). E: Gated lymphoblasts (P2) on CD10 vs CD19 plot. F: 0.7% of gated lymphoblasts express CD25, which is considered negative.
