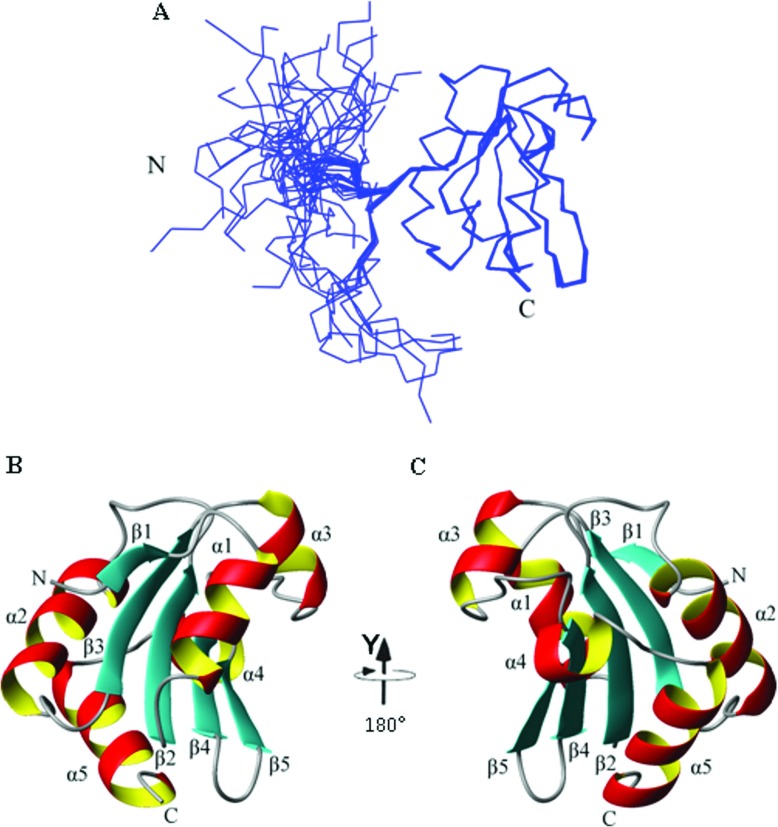
Figure 3. Solution structure of the ERp27 b domain.
(A) Superimposition of the ensemble of 50 representative structures, residues 26–141. Each structural model in the ensemble was superimposed over the mean structure for the ordered region 39–141. The mean structure was calculated using MOLMOL [46]. The Cα traces are shown. The positions of the N- and C-termini are labelled N and C respectively. (B) and (C) show the single representative structure of ERp27 b, residues 39–141 and are related by a 180° rotation about the y-axis. Secondary structure elements are labelled.

