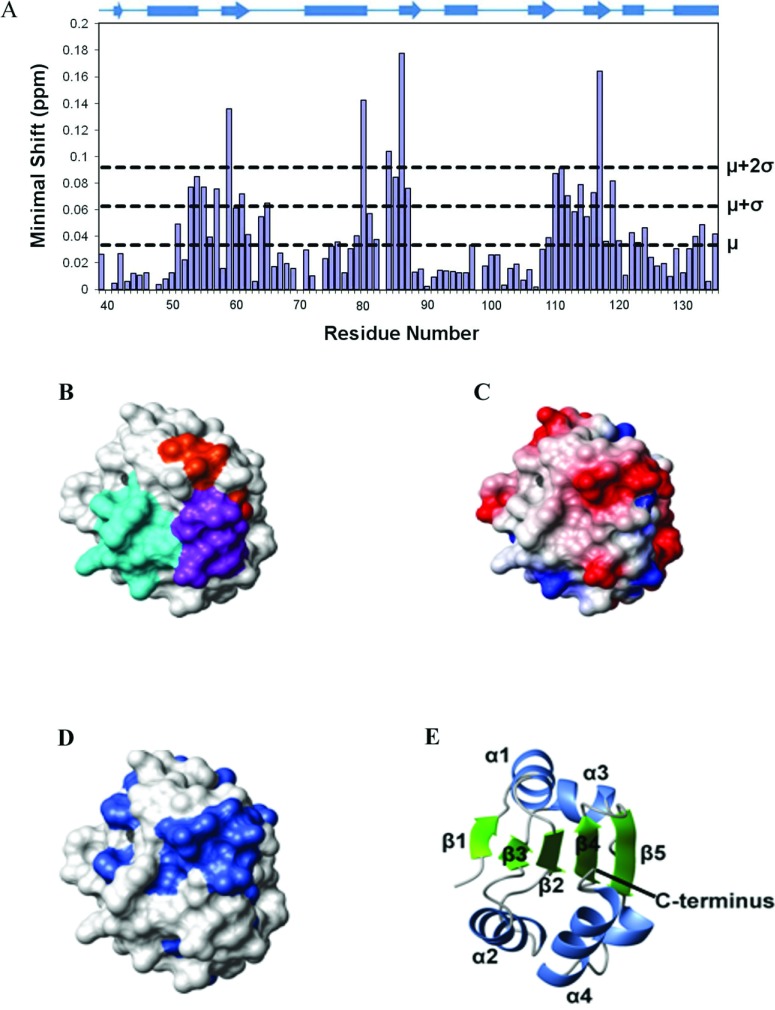
Figure 5. Mapping of the b to b′ domain interface on the b domain of ERp27.
(A) Histogram showing the minimal chemical shifts per residue for ERp27 b (residues 39–135). The secondary structure is indicated above the histogram. Cylinders represent α-helices and arrows represent β-strands. The minimal shift values corresponding to the mean (μ), mean+1 S.D. (μ+σ) and mean+2 S.D. (μ+2σ) are marked by horizontal lines. (B–D) The contact molecular surface generated using MOLMOL with default settings [46]. In (B), residues are coloured according to the regions of structure showing the highest minimal shift values; residues 53–65 are coloured cyan, residues 80–87 are coloured orange and residues 110–119 are coloured purple. In (C), the electrostatic potential generated using MOLMOL is shown; blue represents positive charge, red represents negative charge and white represents neutral charge. In (D), sequence conservation is mapped on to the structure; residues with >80% identity (in the alignment in Supplementary Figure S3 at http://www.biochemj.org/bj/450/bj4500321add.htm) are coloured. (E) Cartoon representation of the protein backbone showing the orientation of the protein used for (B–D).

