Figure 3.
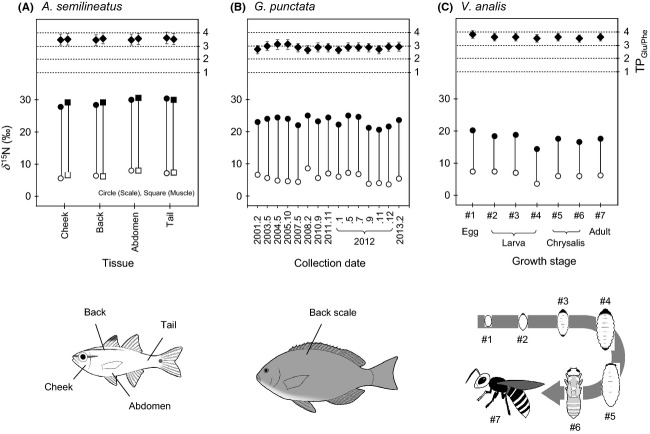
δ15N values of glutamic acid and phenylalanine and the TPGlu/Phe values for (A) difference parts (cheek, back, abdomen, and tail) and tissues (scale and muscle) within a single fish Apogon semilineatus, (B) different individuals of a fish Girella punctata collected during 2001–2013, and (C) different growth stages of a hornet Vespa analis. Bar represents potential uncertainly in TPGlu/Phe calculated by taking into account the propagation of 1σ for δ15NGlu, δ15NPhe, β, and TDF in eq. (1).

