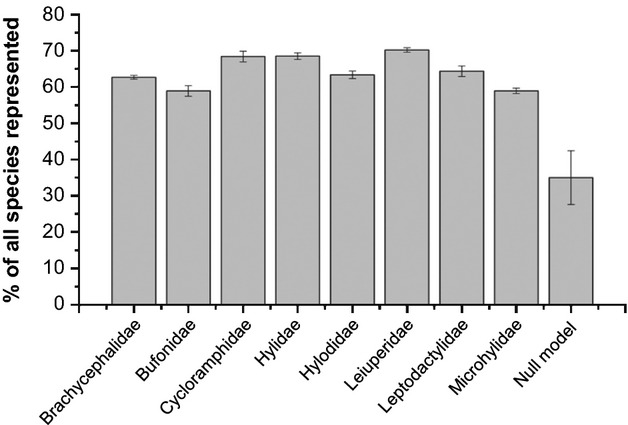
Figure 2.

Efficiency of indicator groups to represent the amphibian species in the Brazilian Atlantic Forest. Gray bars represent the mean percentages among the 20 best solutions to represent all species as from the smallest set of grid cells necessary for each indicator group. Error bars denote standard deviations of the means.
