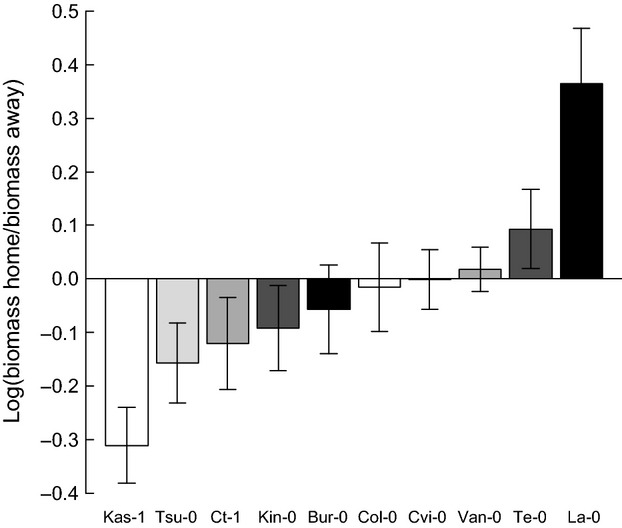
Figure 3.

Average feedback experienced by the 10 Arabidopsis thaliana accessions. Negative values indicate negative feedback (smaller above-ground biomass in “home soil” than in “away soil”), positive values indicate positive feedback (higher above-ground biomass in “home soil” than in “away soil”). See “Statistical analyses” for detailed information on the calculation. Accessions are sorted by feedback strength, that is, from the strongest negative to the strongest positive feedback. Colors facilitate the comparison of accessions with Figure 2. However, please note that there is no statistically significant relationship between above-ground biomass and feedback strength (see Table S3 for the statistical analysis). Bars represent the mean ± standard error. n = 60 for each accession.
