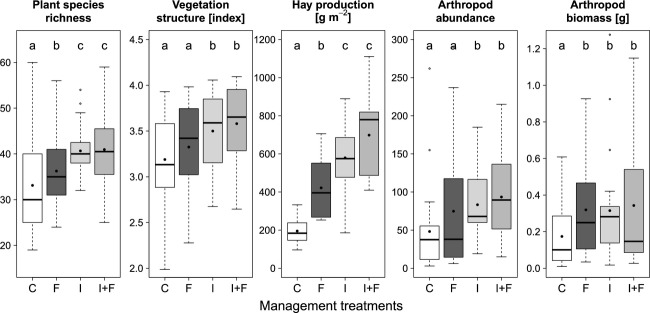
Figure 2.

Responses of the vegetation (plant species richness, vegetation structure and hay production) and arthropod (abundance and dry biomass) variables to the different management treatments. Bold lines represent medians, solid points the means, boxes the first and third quantiles. Different letters indicate significant differences among treatments at an alpha rejection value set to 0.05. Treatments abbreviations are as follows: (C) control; (I) irrigated, (F) fertilized, and (I + F) irrigated and fertilized.
